29
/
en
AIzaSyAYiBZKx7MnpbEhh9jyipgxe19OcubqV5w
April 1, 2024
28227
East Asia & Pacific (excluding high income)
EAP
false
2
1
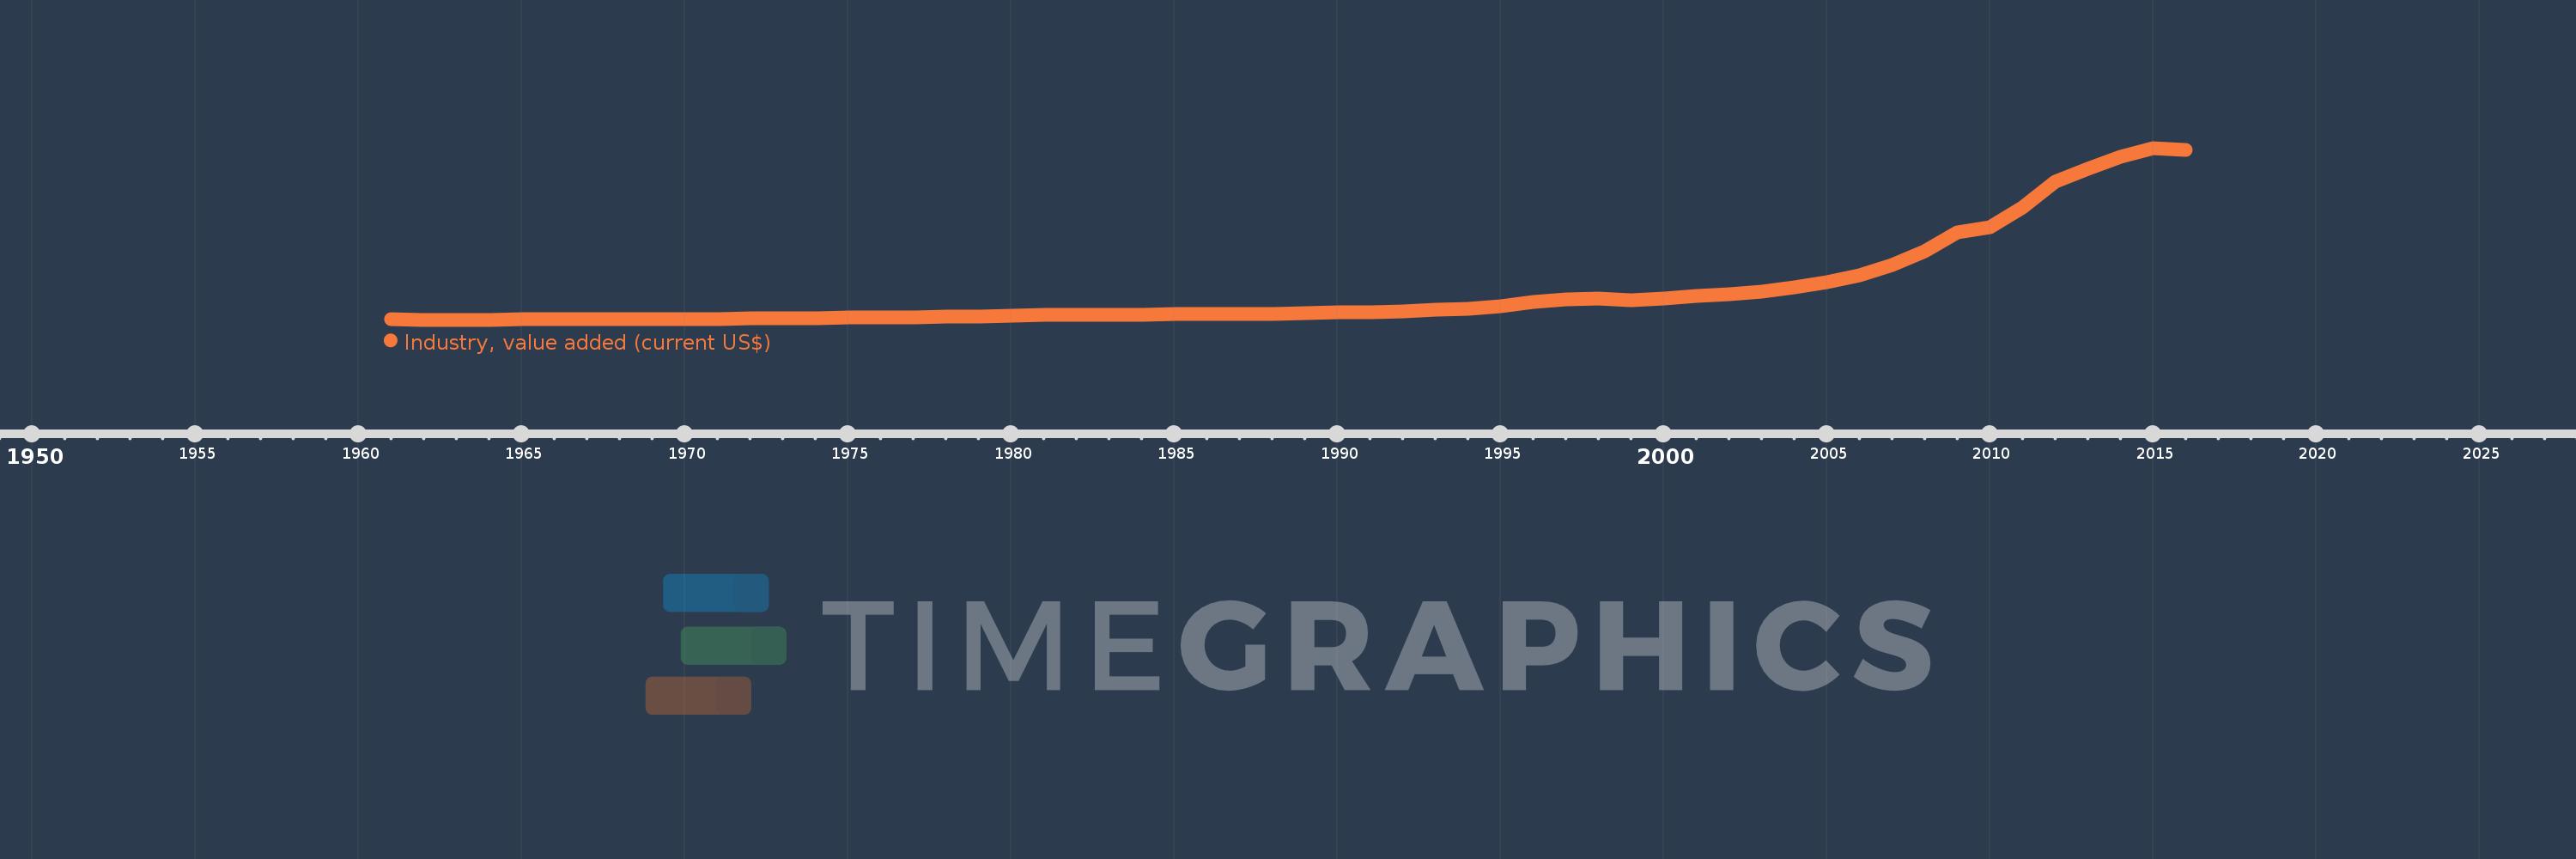
Industry, value added (current US$)
2016,2015,2014,2013,2012,2011,2010,2009,2008,2007,2006,2005,2004,2003,2002,2001,2000,1999,1998,1997,1996,1995,1994,1993,1992,1991,1990,1989,1988,1987,1986,1985,1984,1983,1982,1981,1980,1979,1978,1977,1976,1975,1974,1973,1972,1971,1970,1969,1968,1967,1966,1965,1964,1963,1962,1961
This statistics in other country:
AfghanistanAlbaniaAlgeriaAndorraAngolaAntigua and BarbudaArab WorldArgentinaArmeniaArubaAustraliaAustriaAzerbaijanBahamas, TheBahrainBangladeshBarbadosBelarusBelgiumBelizeBeninBermudaBhutanBoliviaBosnia and HerzegovinaBotswanaBrazilBrunei DarussalamBulgariaBurkina FasoBurundiCabo VerdeCambodiaCameroonCanadaCaribbean small statesCayman IslandsCentral African RepublicCentral Europe and the BalticsChadChileChinaColombiaComorosCongo, Dem. Rep.Congo, Rep.Costa RicaCote d'IvoireCroatiaCubaCyprusCzech RepublicDenmarkDjiboutiDominicaDominican RepublicEarly-demographic dividendEast Asia & PacificEast Asia & Pacific (excluding high income)East Asia & Pacific (IDA & IBRD countries)EcuadorEgypt, Arab Rep.El SalvadorEquatorial GuineaEritreaEstoniaEthiopiaEuro areaEurope & Central AsiaEurope & Central Asia (excluding high income)Europe & Central Asia (IDA & IBRD countries)European UnionFijiFinlandFragile and conflict affected situationsFranceGabonGambia, TheGeorgiaGermanyGhanaGreeceGrenadaGuatemalaGuineaGuinea-BissauGuyanaHeavily indebted poor countries (HIPC)High incomeHondurasHong Kong SAR, ChinaHungaryIBRD onlyIcelandIDA & IBRD totalIDA blendIDA onlyIDA totalIndiaIndonesiaIran, Islamic Rep.IraqIrelandItalyJamaicaJapanJordanKazakhstanKenyaKiribatiKorea, Rep.KosovoKuwaitKyrgyz RepublicLao PDRLate-demographic dividendLatin America & Caribbean Latin America & Caribbean (excluding high income)Latin America & the Caribbean (IDA & IBRD countries)LatviaLeast developed countries: UN classificationLebanonLesothoLiberiaLibyaLiechtensteinLithuaniaLow & middle incomeLow incomeLower middle incomeLuxembourgMacao SAR, ChinaMacedonia, FYRMadagascarMalawiMalaysiaMaldivesMaliMaltaMarshall IslandsMauritaniaMauritiusMexicoMicronesia, Fed. Sts.Middle East & North AfricaMiddle East & North Africa (excluding high income)Middle East & North Africa (IDA & IBRD countries)Middle incomeMoldovaMongoliaMontenegroMoroccoMozambiqueMyanmarNamibiaNepalNetherlandsNew CaledoniaNew ZealandNicaraguaNigerNigeriaNorth AmericaNorwayOECD membersOmanOther small statesPacific island small statesPakistanPalauPanamaPapua New GuineaParaguayPeruPhilippinesPolandPortugalPost-demographic dividendPre-demographic dividendPuerto RicoQatarRomaniaRussian FederationRwandaSamoaSao Tome and PrincipeSaudi ArabiaSenegalSerbiaSeychellesSierra LeoneSingaporeSlovak RepublicSloveniaSmall statesSolomon IslandsSouth AfricaSouth AsiaSouth Asia (IDA & IBRD)SpainSri LankaSt. Kitts and NevisSt. LuciaSt. Vincent and the GrenadinesSub-Saharan Africa Sub-Saharan Africa (excluding high income)Sub-Saharan Africa (IDA & IBRD countries)SudanSurinameSwazilandSwedenSwitzerlandSyrian Arab RepublicTajikistanTanzaniaThailandTimor-LesteTogoTongaTrinidad and TobagoTunisiaTurkeyTurkmenistanTuvaluUgandaUkraineUnited Arab EmiratesUnited KingdomUnited StatesUpper middle incomeUruguayUzbekistanVanuatuVenezuela, RBVietnamWest Bank and GazaWorldYemen, Rep.ZambiaZimbabwe Timeline:
This timeline shows a graph from 1961 to 2016 of East Asia & Pacific (excluding high income). No data until 1960. Number of actual observations by date: 56.
Source name:
World Development Indicators
Source organization:
World Bank national accounts data, and OECD National Accounts data files.
Categories, topics:
Economy & Growth
Last updated:
apr 23, 2017
Indicators value changes by year
Minimum:
18.518 bln
jan 1, 1963
Maximum:
5.381 trl
jan 1, 2015
At the date of observation
Value
Absolute change
Change from previous value
jan 1, 1961
31.366 bln
+31.366 bln
0.0%
jan 1, 1962
20.545 bln
-10.821 bln
-34.5%
jan 1, 1963
18.518 bln
-2.027 bln
-9.87%
jan 1, 1964
20.927 bln
+2.409 bln
13.01%
jan 1, 1965
25.848 bln
+4.921 bln
23.51%
jan 1, 1966
30.113 bln
+4.264 bln
16.5%
jan 1, 1967
35.156 bln
+5.044 bln
16.75%
jan 1, 1968
30.976 bln
-4.18 bln
-11.89%
jan 1, 1969
28.97 bln
-2.006 bln
-6.48%
jan 1, 1970
36.289 bln
+7.319 bln
25.26%
jan 1, 1971
45.72 bln
+9.431 bln
25.99%
jan 1, 1972
51.289 bln
+5.569 bln
12.18%
jan 1, 1973
60.129 bln
+8.84 bln
17.24%
jan 1, 1974
75.385 bln
+15.257 bln
25.37%
jan 1, 1975
85.414 bln
+10.028 bln
13.3%
jan 1, 1976
100.773 bln
+15.359 bln
17.98%
jan 1, 1977
101.201 bln
+427.784 mln
0.42%
jan 1, 1978
120.446 bln
+19.245 bln
19.02%
jan 1, 1979
116.574 bln
-3.872 bln
-3.21%
jan 1, 1980
136.394 bln
+19.82 bln
17.0%
jan 1, 1981
162.138 bln
+25.744 bln
18.87%
jan 1, 1982
168.582 bln
+6.444 bln
3.97%
jan 1, 1983
168.73 bln
+147.714 mln
0.09%
jan 1, 1984
179.355 bln
+10.625 bln
6.3%
jan 1, 1985
190.714 bln
+11.359 bln
6.33%
jan 1, 1986
205.604 bln
+14.89 bln
7.81%
jan 1, 1987
204.169 bln
-1.434 bln
-0.7%
jan 1, 1988
200.317 bln
-3.853 bln
-1.89%
jan 1, 1989
227.265 bln
+26.948 bln
13.45%
jan 1, 1990
249.056 bln
+21.792 bln
9.59%
jan 1, 1991
264.086 bln
+15.029 bln
6.03%
jan 1, 1992
291.763 bln
+27.677 bln
10.48%
jan 1, 1993
330.977 bln
+39.214 bln
13.44%
jan 1, 1994
369.424 bln
+38.446 bln
11.62%
jan 1, 1995
448.072 bln
+78.648 bln
21.29%
jan 1, 1996
564.276 bln
+116.204 bln
25.93%
jan 1, 1997
658.981 bln
+94.705 bln
16.78%
jan 1, 1998
690.489 bln
+31.508 bln
4.78%
jan 1, 1999
627.149 bln
-63.34 bln
-9.17%
jan 1, 2000
683.95 bln
+56.8 bln
9.06%
jan 1, 2001
766.015 bln
+82.066 bln
12.0%
jan 1, 2002
807.321 bln
+41.305 bln
5.39%
jan 1, 2003
885.46 bln
+78.139 bln
9.68%
jan 1, 2004
1.024 trl
+138.279 bln
15.62%
jan 1, 2005
1.199 trl
+175.334 bln
17.13%
jan 1, 2006
1.417 trl
+218.236 bln
18.2%
jan 1, 2007
1.725 trl
+308.149 bln
21.74%
jan 1, 2008
2.153 trl
+427.466 bln
24.77%
jan 1, 2009
2.74 trl
+586.969 bln
27.26%
jan 1, 2010
2.912 trl
+172.174 bln
6.28%
jan 1, 2011
3.528 trl
+616.32 bln
21.16%
jan 1, 2012
4.324 trl
+795.224 bln
22.54%
jan 1, 2013
4.729 trl
+405.068 bln
9.37%
jan 1, 2014
5.093 trl
+363.893 bln
7.7%
jan 1, 2015
5.381 trl
+287.998 bln
5.66%
jan 1, 2016
5.317 trl
-63.847 bln
-1.19%
Ranking of countries by current statistics by years


Comments: