29
/
en
AIzaSyAYiBZKx7MnpbEhh9jyipgxe19OcubqV5w
April 1, 2024
112401
Costa Rica
CRI
true
2
1
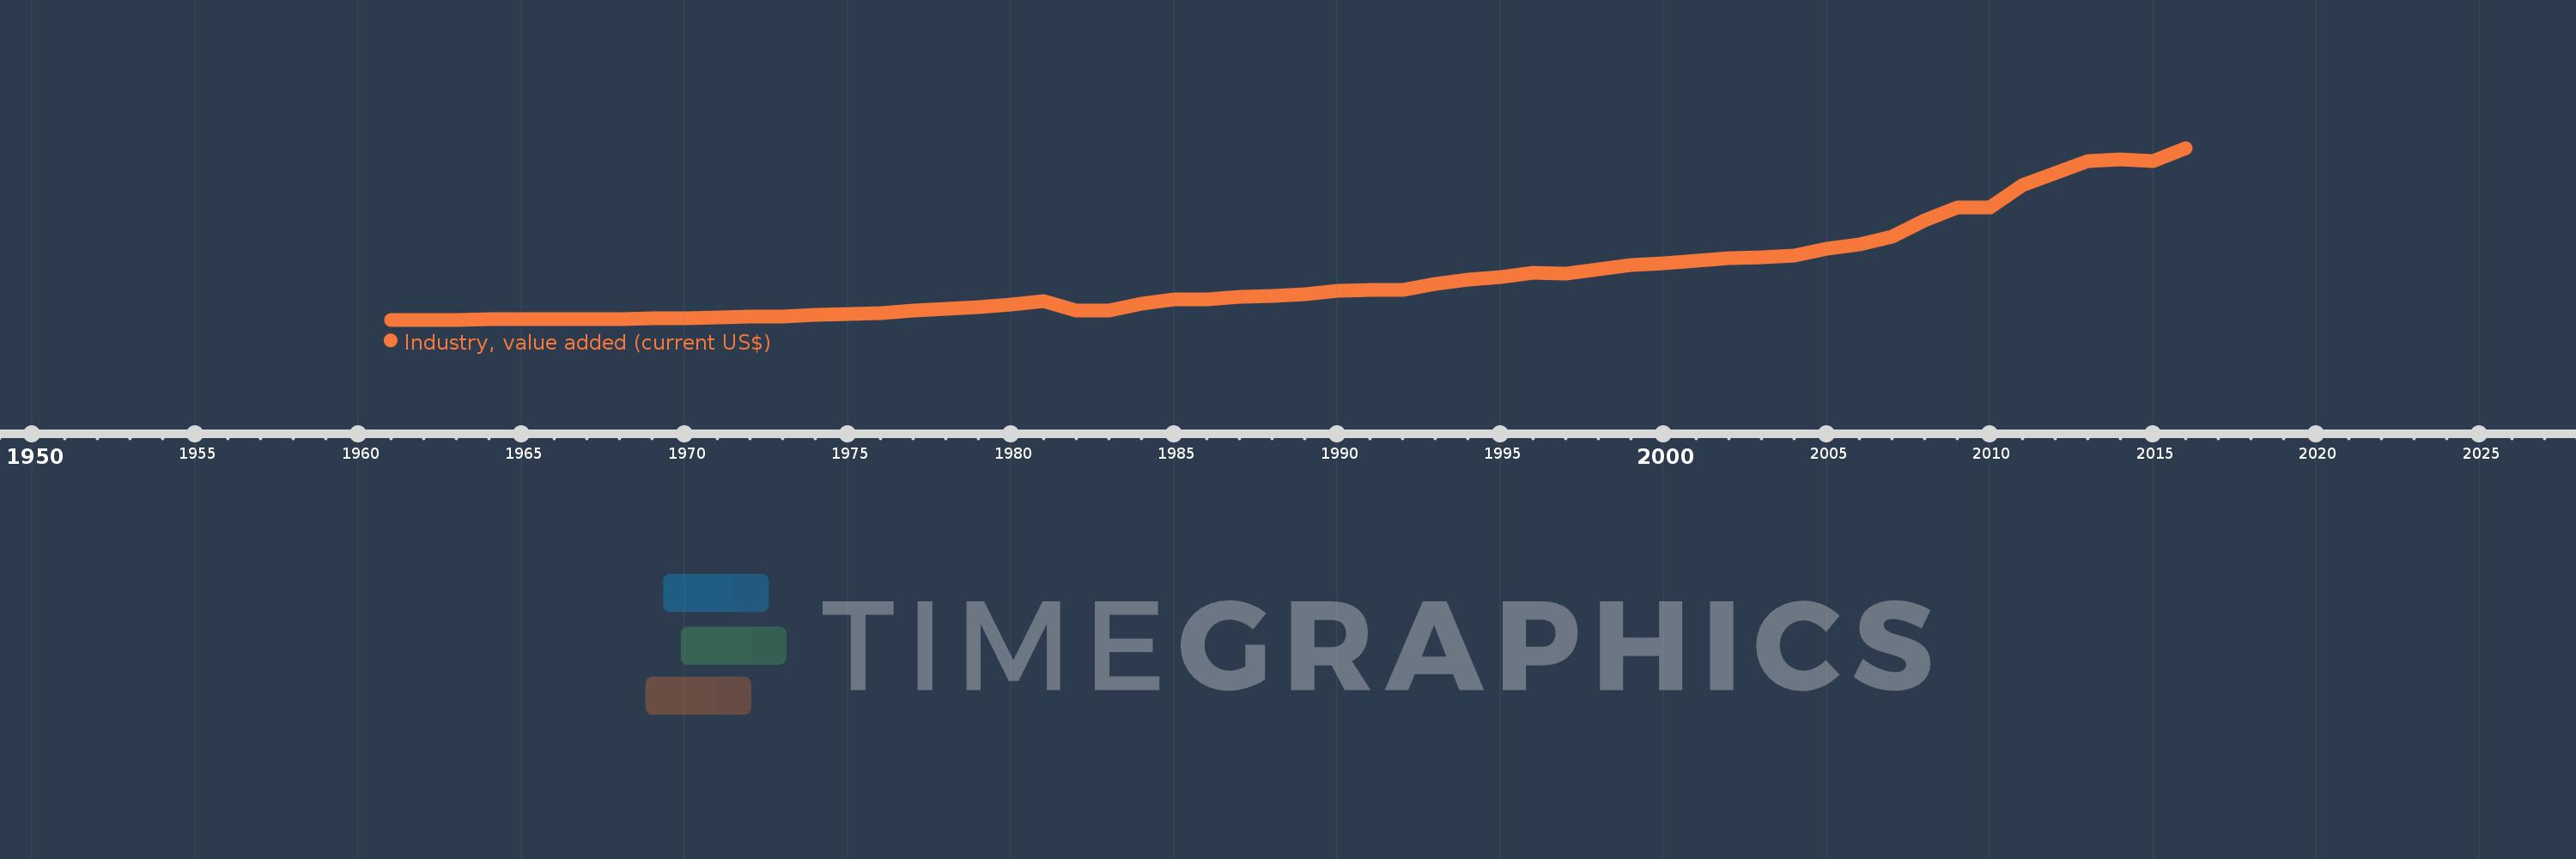
Industry, value added (current US$)
2016,2015,2014,2013,2012,2011,2010,2009,2008,2007,2006,2005,2004,2003,2002,2001,2000,1999,1998,1997,1996,1995,1994,1993,1992,1991,1990,1989,1988,1987,1986,1985,1984,1983,1982,1981,1980,1979,1978,1977,1976,1975,1974,1973,1972,1971,1970,1969,1968,1967,1966,1965,1964,1963,1962,1961
This statistics in other country:
AfghanistanAlbaniaAlgeriaAndorraAngolaAntigua and BarbudaArab WorldArgentinaArmeniaArubaAustraliaAustriaAzerbaijanBahamas, TheBahrainBangladeshBarbadosBelarusBelgiumBelizeBeninBermudaBhutanBoliviaBosnia and HerzegovinaBotswanaBrazilBrunei DarussalamBulgariaBurkina FasoBurundiCabo VerdeCambodiaCameroonCanadaCaribbean small statesCayman IslandsCentral African RepublicCentral Europe and the BalticsChadChileChinaColombiaComorosCongo, Dem. Rep.Congo, Rep.Costa RicaCote d'IvoireCroatiaCubaCyprusCzech RepublicDenmarkDjiboutiDominicaDominican RepublicEarly-demographic dividendEast Asia & PacificEast Asia & Pacific (excluding high income)East Asia & Pacific (IDA & IBRD countries)EcuadorEgypt, Arab Rep.El SalvadorEquatorial GuineaEritreaEstoniaEthiopiaEuro areaEurope & Central AsiaEurope & Central Asia (excluding high income)Europe & Central Asia (IDA & IBRD countries)European UnionFijiFinlandFragile and conflict affected situationsFranceGabonGambia, TheGeorgiaGermanyGhanaGreeceGrenadaGuatemalaGuineaGuinea-BissauGuyanaHeavily indebted poor countries (HIPC)High incomeHondurasHong Kong SAR, ChinaHungaryIBRD onlyIcelandIDA & IBRD totalIDA blendIDA onlyIDA totalIndiaIndonesiaIran, Islamic Rep.IraqIrelandItalyJamaicaJapanJordanKazakhstanKenyaKiribatiKorea, Rep.KosovoKuwaitKyrgyz RepublicLao PDRLate-demographic dividendLatin America & Caribbean Latin America & Caribbean (excluding high income)Latin America & the Caribbean (IDA & IBRD countries)LatviaLeast developed countries: UN classificationLebanonLesothoLiberiaLibyaLiechtensteinLithuaniaLow & middle incomeLow incomeLower middle incomeLuxembourgMacao SAR, ChinaMacedonia, FYRMadagascarMalawiMalaysiaMaldivesMaliMaltaMarshall IslandsMauritaniaMauritiusMexicoMicronesia, Fed. Sts.Middle East & North AfricaMiddle East & North Africa (excluding high income)Middle East & North Africa (IDA & IBRD countries)Middle incomeMoldovaMongoliaMontenegroMoroccoMozambiqueMyanmarNamibiaNepalNetherlandsNew CaledoniaNew ZealandNicaraguaNigerNigeriaNorth AmericaNorwayOECD membersOmanOther small statesPacific island small statesPakistanPalauPanamaPapua New GuineaParaguayPeruPhilippinesPolandPortugalPost-demographic dividendPre-demographic dividendPuerto RicoQatarRomaniaRussian FederationRwandaSamoaSao Tome and PrincipeSaudi ArabiaSenegalSerbiaSeychellesSierra LeoneSingaporeSlovak RepublicSloveniaSmall statesSolomon IslandsSouth AfricaSouth AsiaSouth Asia (IDA & IBRD)SpainSri LankaSt. Kitts and NevisSt. LuciaSt. Vincent and the GrenadinesSub-Saharan Africa Sub-Saharan Africa (excluding high income)Sub-Saharan Africa (IDA & IBRD countries)SudanSurinameSwazilandSwedenSwitzerlandSyrian Arab RepublicTajikistanTanzaniaThailandTimor-LesteTogoTongaTrinidad and TobagoTunisiaTurkeyTurkmenistanTuvaluUgandaUkraineUnited Arab EmiratesUnited KingdomUnited StatesUpper middle incomeUruguayUzbekistanVanuatuVenezuela, RBVietnamWest Bank and GazaWorldYemen, Rep.ZambiaZimbabwe Timeline:
This timeline shows a graph from 1961 to 2016 of Costa Rica. No data until 1960. Number of actual observations by date: 56.
Source name:
World Development Indicators
Source organization:
World Bank national accounts data, and OECD National Accounts data files.
Categories, topics:
Economy & Growth
Last updated:
apr 23, 2017
Indicators value changes by year
Minimum:
97.848 mln
jan 1, 1963
Maximum:
11.009 bln
jan 1, 2016
At the date of observation
Value
Absolute change
Change from previous value
jan 1, 1961
99.888 mln
+99.888 mln
0.0%
jan 1, 1962
99.026 mln
-862.39K
-0.86%
jan 1, 1963
97.848 mln
-1.178 mln
-1.19%
jan 1, 1964
109.322 mln
+11.474 mln
11.73%
jan 1, 1965
117.863 mln
+8.541 mln
7.81%
jan 1, 1966
136.589 mln
+18.726 mln
15.89%
jan 1, 1967
147.955 mln
+11.366 mln
8.32%
jan 1, 1968
161.449 mln
+13.494 mln
9.12%
jan 1, 1969
185.63 mln
+24.181 mln
14.98%
jan 1, 1970
204.272 mln
+18.642 mln
10.04%
jan 1, 1971
238.4 mln
+34.128 mln
16.71%
jan 1, 1972
274.156 mln
+35.756 mln
15.0%
jan 1, 1973
323.255 mln
+49.1 mln
17.91%
jan 1, 1974
408.211 mln
+84.956 mln
26.28%
jan 1, 1975
459.571 mln
+51.36 mln
12.58%
jan 1, 1976
536.744 mln
+77.173 mln
16.79%
jan 1, 1977
662.205 mln
+125.461 mln
23.37%
jan 1, 1978
803.827 mln
+141.622 mln
21.39%
jan 1, 1979
918.413 mln
+114.586 mln
14.26%
jan 1, 1980
1.068 bln
+149.253 mln
16.25%
jan 1, 1981
1.303 bln
+235.263 mln
22.04%
jan 1, 1982
698.488 mln
-604.441 mln
-46.39%
jan 1, 1983
670.925 mln
-27.563 mln
-3.95%
jan 1, 1984
1.142 bln
+471.34 mln
70.25%
jan 1, 1985
1.377 bln
+234.729 mln
20.55%
jan 1, 1986
1.414 bln
+36.975 mln
2.69%
jan 1, 1987
1.555 bln
+141.096 mln
9.98%
jan 1, 1988
1.634 bln
+79.164 mln
5.09%
jan 1, 1989
1.723 bln
+88.834 mln
5.44%
jan 1, 1990
1.961 bln
+237.439 mln
13.78%
jan 1, 1991
2.0 bln
+39.492 mln
2.01%
jan 1, 1992
1.97 bln
-30.183 mln
-1.51%
jan 1, 1993
2.386 bln
+416.564 mln
21.15%
jan 1, 1994
2.621 bln
+234.753 mln
9.84%
jan 1, 1995
2.789 bln
+168.285 mln
6.42%
jan 1, 1996
3.074 bln
+284.331 mln
10.19%
jan 1, 1997
3.033 bln
-41.103 mln
-1.34%
jan 1, 1998
3.285 bln
+251.942 mln
8.31%
jan 1, 1999
3.555 bln
+270.735 mln
8.24%
jan 1, 2000
3.666 bln
+111.07 mln
3.12%
jan 1, 2001
3.82 bln
+153.565 mln
4.19%
jan 1, 2002
4.028 bln
+207.944 mln
5.44%
jan 1, 2003
4.072 bln
+43.858 mln
1.09%
jan 1, 2004
4.175 bln
+103.517 mln
2.54%
jan 1, 2005
4.591 bln
+415.448 mln
9.95%
jan 1, 2006
4.864 bln
+272.861 mln
5.94%
jan 1, 2007
5.387 bln
+523.237 mln
10.76%
jan 1, 2008
6.422 bln
+1.035 bln
19.22%
jan 1, 2009
7.252 bln
+830.175 mln
12.93%
jan 1, 2010
7.226 bln
-25.714 mln
-0.35%
jan 1, 2011
8.661 bln
+1.435 bln
19.85%
jan 1, 2012
9.433 bln
+771.971 mln
8.91%
jan 1, 2013
10.194 bln
+760.677 mln
8.06%
jan 1, 2014
10.266 bln
+71.797 mln
0.7%
jan 1, 2015
10.176 bln
-89.166 mln
-0.87%
jan 1, 2016
11.009 bln
+832.71 mln
8.18%
Ranking of countries by current statistics by years


Comments: