29
/
en
AIzaSyAYiBZKx7MnpbEhh9jyipgxe19OcubqV5w
April 1, 2024
39094
IDA only
IDX
false
2
1
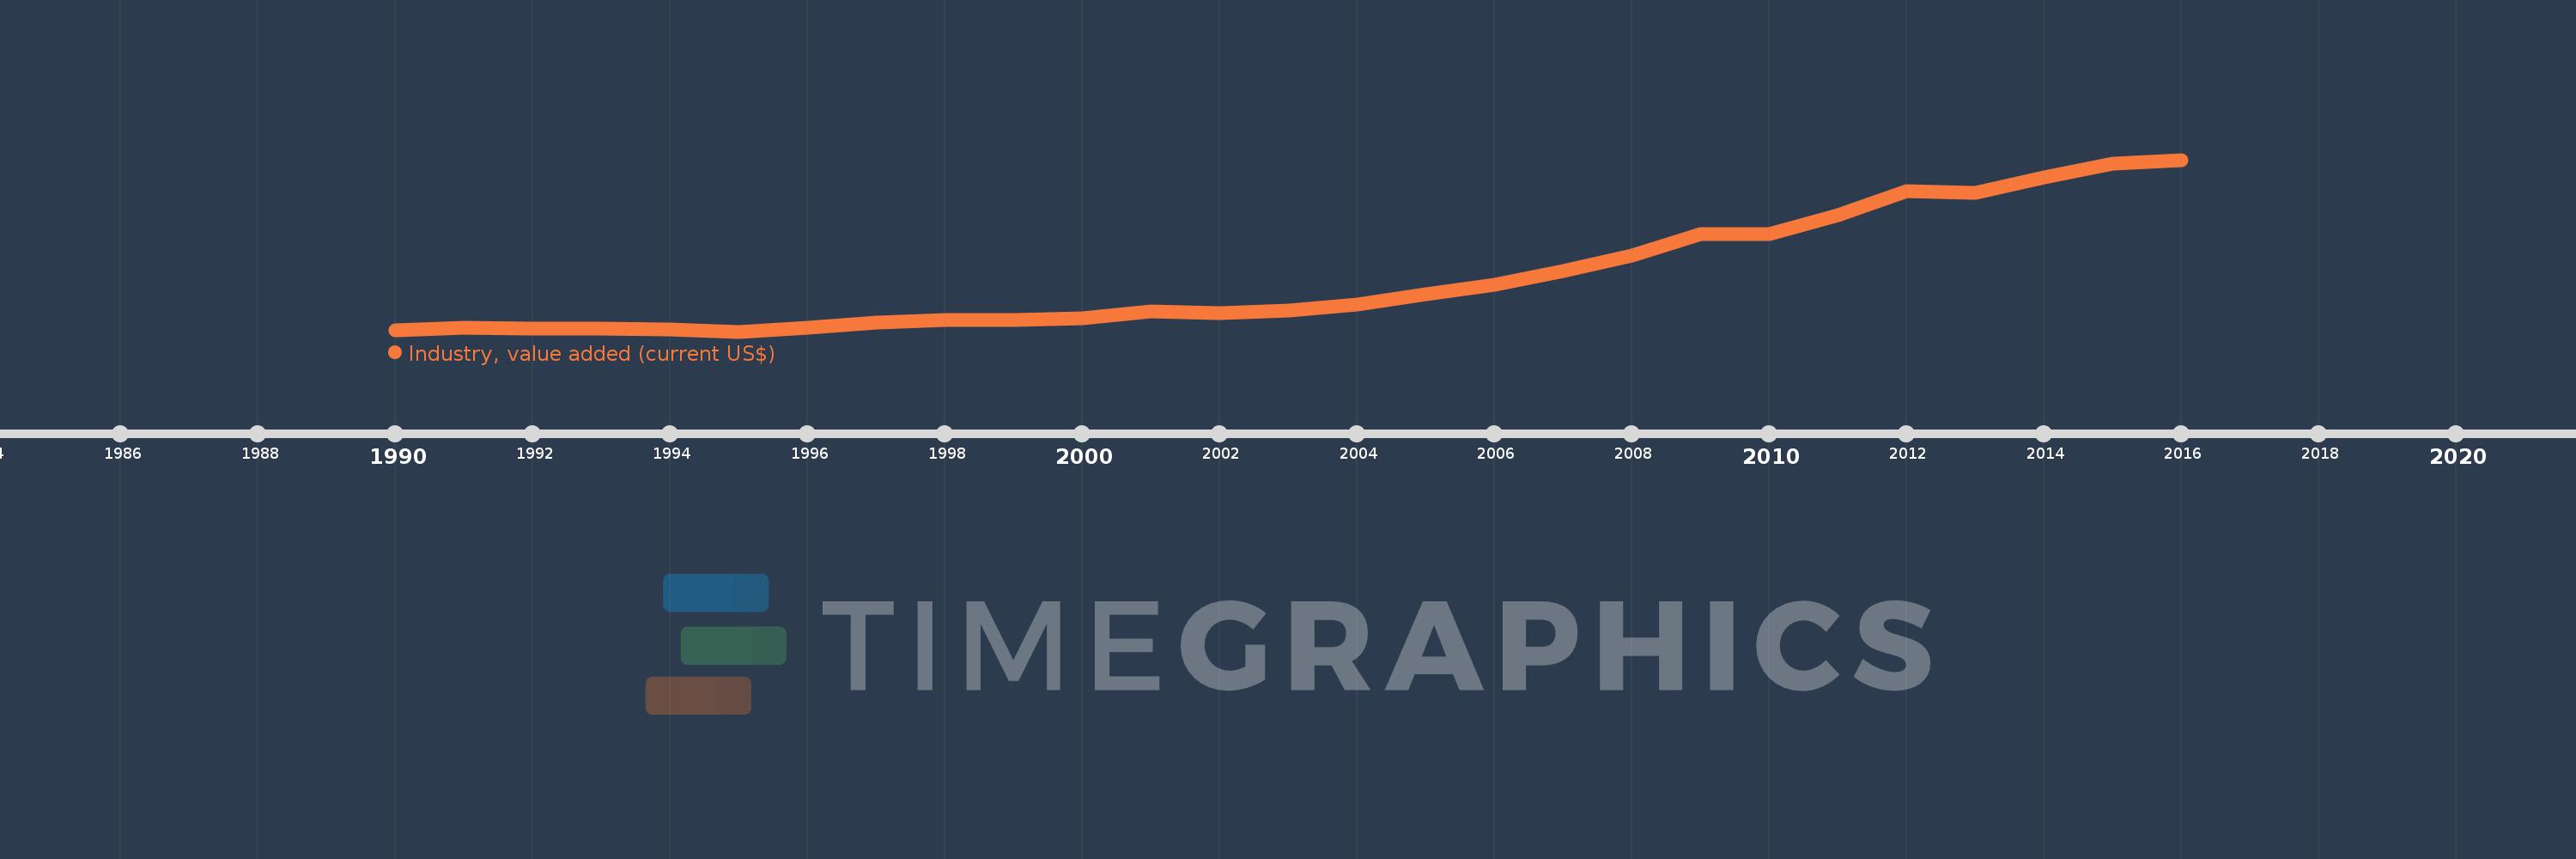
Industry, value added (current US$)
2016,2015,2014,2013,2012,2011,2010,2009,2008,2007,2006,2005,2004,2003,2002,2001,2000,1999,1998,1997,1996,1995,1994,1993,1992,1991,1990
This statistics in other country:
AfghanistanAlbaniaAlgeriaAndorraAngolaAntigua and BarbudaArab WorldArgentinaArmeniaArubaAustraliaAustriaAzerbaijanBahamas, TheBahrainBangladeshBarbadosBelarusBelgiumBelizeBeninBermudaBhutanBoliviaBosnia and HerzegovinaBotswanaBrazilBrunei DarussalamBulgariaBurkina FasoBurundiCabo VerdeCambodiaCameroonCanadaCaribbean small statesCayman IslandsCentral African RepublicCentral Europe and the BalticsChadChileChinaColombiaComorosCongo, Dem. Rep.Congo, Rep.Costa RicaCote d'IvoireCroatiaCubaCyprusCzech RepublicDenmarkDjiboutiDominicaDominican RepublicEarly-demographic dividendEast Asia & PacificEast Asia & Pacific (excluding high income)East Asia & Pacific (IDA & IBRD countries)EcuadorEgypt, Arab Rep.El SalvadorEquatorial GuineaEritreaEstoniaEthiopiaEuro areaEurope & Central AsiaEurope & Central Asia (excluding high income)Europe & Central Asia (IDA & IBRD countries)European UnionFijiFinlandFragile and conflict affected situationsFranceGabonGambia, TheGeorgiaGermanyGhanaGreeceGrenadaGuatemalaGuineaGuinea-BissauGuyanaHeavily indebted poor countries (HIPC)High incomeHondurasHong Kong SAR, ChinaHungaryIBRD onlyIcelandIDA & IBRD totalIDA blendIDA onlyIDA totalIndiaIndonesiaIran, Islamic Rep.IraqIrelandItalyJamaicaJapanJordanKazakhstanKenyaKiribatiKorea, Rep.KosovoKuwaitKyrgyz RepublicLao PDRLate-demographic dividendLatin America & Caribbean Latin America & Caribbean (excluding high income)Latin America & the Caribbean (IDA & IBRD countries)LatviaLeast developed countries: UN classificationLebanonLesothoLiberiaLibyaLiechtensteinLithuaniaLow & middle incomeLow incomeLower middle incomeLuxembourgMacao SAR, ChinaMacedonia, FYRMadagascarMalawiMalaysiaMaldivesMaliMaltaMarshall IslandsMauritaniaMauritiusMexicoMicronesia, Fed. Sts.Middle East & North AfricaMiddle East & North Africa (excluding high income)Middle East & North Africa (IDA & IBRD countries)Middle incomeMoldovaMongoliaMontenegroMoroccoMozambiqueMyanmarNamibiaNepalNetherlandsNew CaledoniaNew ZealandNicaraguaNigerNigeriaNorth AmericaNorwayOECD membersOmanOther small statesPacific island small statesPakistanPalauPanamaPapua New GuineaParaguayPeruPhilippinesPolandPortugalPost-demographic dividendPre-demographic dividendPuerto RicoQatarRomaniaRussian FederationRwandaSamoaSao Tome and PrincipeSaudi ArabiaSenegalSerbiaSeychellesSierra LeoneSingaporeSlovak RepublicSloveniaSmall statesSolomon IslandsSouth AfricaSouth AsiaSouth Asia (IDA & IBRD)SpainSri LankaSt. Kitts and NevisSt. LuciaSt. Vincent and the GrenadinesSub-Saharan Africa Sub-Saharan Africa (excluding high income)Sub-Saharan Africa (IDA & IBRD countries)SudanSurinameSwazilandSwedenSwitzerlandSyrian Arab RepublicTajikistanTanzaniaThailandTimor-LesteTogoTongaTrinidad and TobagoTunisiaTurkeyTurkmenistanTuvaluUgandaUkraineUnited Arab EmiratesUnited KingdomUnited StatesUpper middle incomeUruguayUzbekistanVanuatuVenezuela, RBVietnamWest Bank and GazaWorldYemen, Rep.ZambiaZimbabwe Timeline:
This timeline shows a graph from 1990 to 2016 of IDA only. No data until 1989. Number of actual observations by date: 27.
Source name:
World Development Indicators
Source organization:
World Bank national accounts data, and OECD National Accounts data files.
Categories, topics:
Economy & Growth
Last updated:
apr 23, 2017
Indicators value changes by year
Minimum:
31.796 bln
jan 1, 1995
Maximum:
254.527 bln
jan 1, 2016
At the date of observation
Value
Absolute change
Change from previous value
jan 1, 1990
33.759 bln
+33.759 bln
0.0%
jan 1, 1991
36.52 bln
+2.761 bln
8.18%
jan 1, 1992
36.054 bln
-465.773 mln
-1.28%
jan 1, 1993
35.251 bln
-803.521 mln
-2.23%
jan 1, 1994
34.438 bln
-812.406 mln
-2.3%
jan 1, 1995
31.796 bln
-2.643 bln
-7.67%
jan 1, 1996
36.492 bln
+4.696 bln
14.77%
jan 1, 1997
43.354 bln
+6.863 bln
18.81%
jan 1, 1998
46.319 bln
+2.964 bln
6.84%
jan 1, 1999
47.126 bln
+807.178 mln
1.74%
jan 1, 2000
49.541 bln
+2.415 bln
5.12%
jan 1, 2001
57.945 bln
+8.404 bln
16.96%
jan 1, 2002
55.767 bln
-2.178 bln
-3.76%
jan 1, 2003
59.58 bln
+3.814 bln
6.84%
jan 1, 2004
66.72 bln
+7.139 bln
11.98%
jan 1, 2005
80.526 bln
+13.807 bln
20.69%
jan 1, 2006
92.517 bln
+11.991 bln
14.89%
jan 1, 2007
110.056 bln
+17.539 bln
18.96%
jan 1, 2008
130.623 bln
+20.567 bln
18.69%
jan 1, 2009
158.315 bln
+27.693 bln
21.2%
jan 1, 2010
158.018 bln
-297.455 mln
-0.19%
jan 1, 2011
182.664 bln
+24.645 bln
15.6%
jan 1, 2012
214.14 bln
+31.476 bln
17.23%
jan 1, 2013
211.136 bln
-3.004 bln
-1.4%
jan 1, 2014
231.411 bln
+20.275 bln
9.6%
jan 1, 2015
249.382 bln
+17.971 bln
7.77%
jan 1, 2016
254.527 bln
+5.145 bln
2.06%
Ranking of countries by current statistics by years


Comments: