29
/
en
AIzaSyAYiBZKx7MnpbEhh9jyipgxe19OcubqV5w
April 1, 2024
279936
Vanuatu
VUT
true
2
1
Industry, value added (current US$)
2015,2014,2013,2012,2011,2010,2009,2008,2007,2006,2005,2004,2003,2002,2001,2000,1999,1998,1997,1996,1995,1994,1993,1992,1991,1990,1989,1988,1987,1986,1985,1984,1983,1982,1981,1980
This statistics in other country:
AfghanistanAlbaniaAlgeriaAndorraAngolaAntigua and BarbudaArab WorldArgentinaArmeniaArubaAustraliaAustriaAzerbaijanBahamas, TheBahrainBangladeshBarbadosBelarusBelgiumBelizeBeninBermudaBhutanBoliviaBosnia and HerzegovinaBotswanaBrazilBrunei DarussalamBulgariaBurkina FasoBurundiCabo VerdeCambodiaCameroonCanadaCaribbean small statesCayman IslandsCentral African RepublicCentral Europe and the BalticsChadChileChinaColombiaComorosCongo, Dem. Rep.Congo, Rep.Costa RicaCote d'IvoireCroatiaCubaCyprusCzech RepublicDenmarkDjiboutiDominicaDominican RepublicEarly-demographic dividendEast Asia & PacificEast Asia & Pacific (excluding high income)East Asia & Pacific (IDA & IBRD countries)EcuadorEgypt, Arab Rep.El SalvadorEquatorial GuineaEritreaEstoniaEthiopiaEuro areaEurope & Central AsiaEurope & Central Asia (excluding high income)Europe & Central Asia (IDA & IBRD countries)European UnionFijiFinlandFragile and conflict affected situationsFranceGabonGambia, TheGeorgiaGermanyGhanaGreeceGrenadaGuatemalaGuineaGuinea-BissauGuyanaHeavily indebted poor countries (HIPC)High incomeHondurasHong Kong SAR, ChinaHungaryIBRD onlyIcelandIDA & IBRD totalIDA blendIDA onlyIDA totalIndiaIndonesiaIran, Islamic Rep.IraqIrelandItalyJamaicaJapanJordanKazakhstanKenyaKiribatiKorea, Rep.KosovoKuwaitKyrgyz RepublicLao PDRLate-demographic dividendLatin America & Caribbean Latin America & Caribbean (excluding high income)Latin America & the Caribbean (IDA & IBRD countries)LatviaLeast developed countries: UN classificationLebanonLesothoLiberiaLibyaLiechtensteinLithuaniaLow & middle incomeLow incomeLower middle incomeLuxembourgMacao SAR, ChinaMacedonia, FYRMadagascarMalawiMalaysiaMaldivesMaliMaltaMarshall IslandsMauritaniaMauritiusMexicoMicronesia, Fed. Sts.Middle East & North AfricaMiddle East & North Africa (excluding high income)Middle East & North Africa (IDA & IBRD countries)Middle incomeMoldovaMongoliaMontenegroMoroccoMozambiqueMyanmarNamibiaNepalNetherlandsNew CaledoniaNew ZealandNicaraguaNigerNigeriaNorth AmericaNorwayOECD membersOmanOther small statesPacific island small statesPakistanPalauPanamaPapua New GuineaParaguayPeruPhilippinesPolandPortugalPost-demographic dividendPre-demographic dividendPuerto RicoQatarRomaniaRussian FederationRwandaSamoaSao Tome and PrincipeSaudi ArabiaSenegalSerbiaSeychellesSierra LeoneSingaporeSlovak RepublicSloveniaSmall statesSolomon IslandsSouth AfricaSouth AsiaSouth Asia (IDA & IBRD)SpainSri LankaSt. Kitts and NevisSt. LuciaSt. Vincent and the GrenadinesSub-Saharan Africa Sub-Saharan Africa (excluding high income)Sub-Saharan Africa (IDA & IBRD countries)SudanSurinameSwazilandSwedenSwitzerlandSyrian Arab RepublicTajikistanTanzaniaThailandTimor-LesteTogoTongaTrinidad and TobagoTunisiaTurkeyTurkmenistanTuvaluUgandaUkraineUnited Arab EmiratesUnited KingdomUnited StatesUpper middle incomeUruguayUzbekistanVanuatuVenezuela, RBVietnamWest Bank and GazaWorldYemen, Rep.ZambiaZimbabwe Timeline:
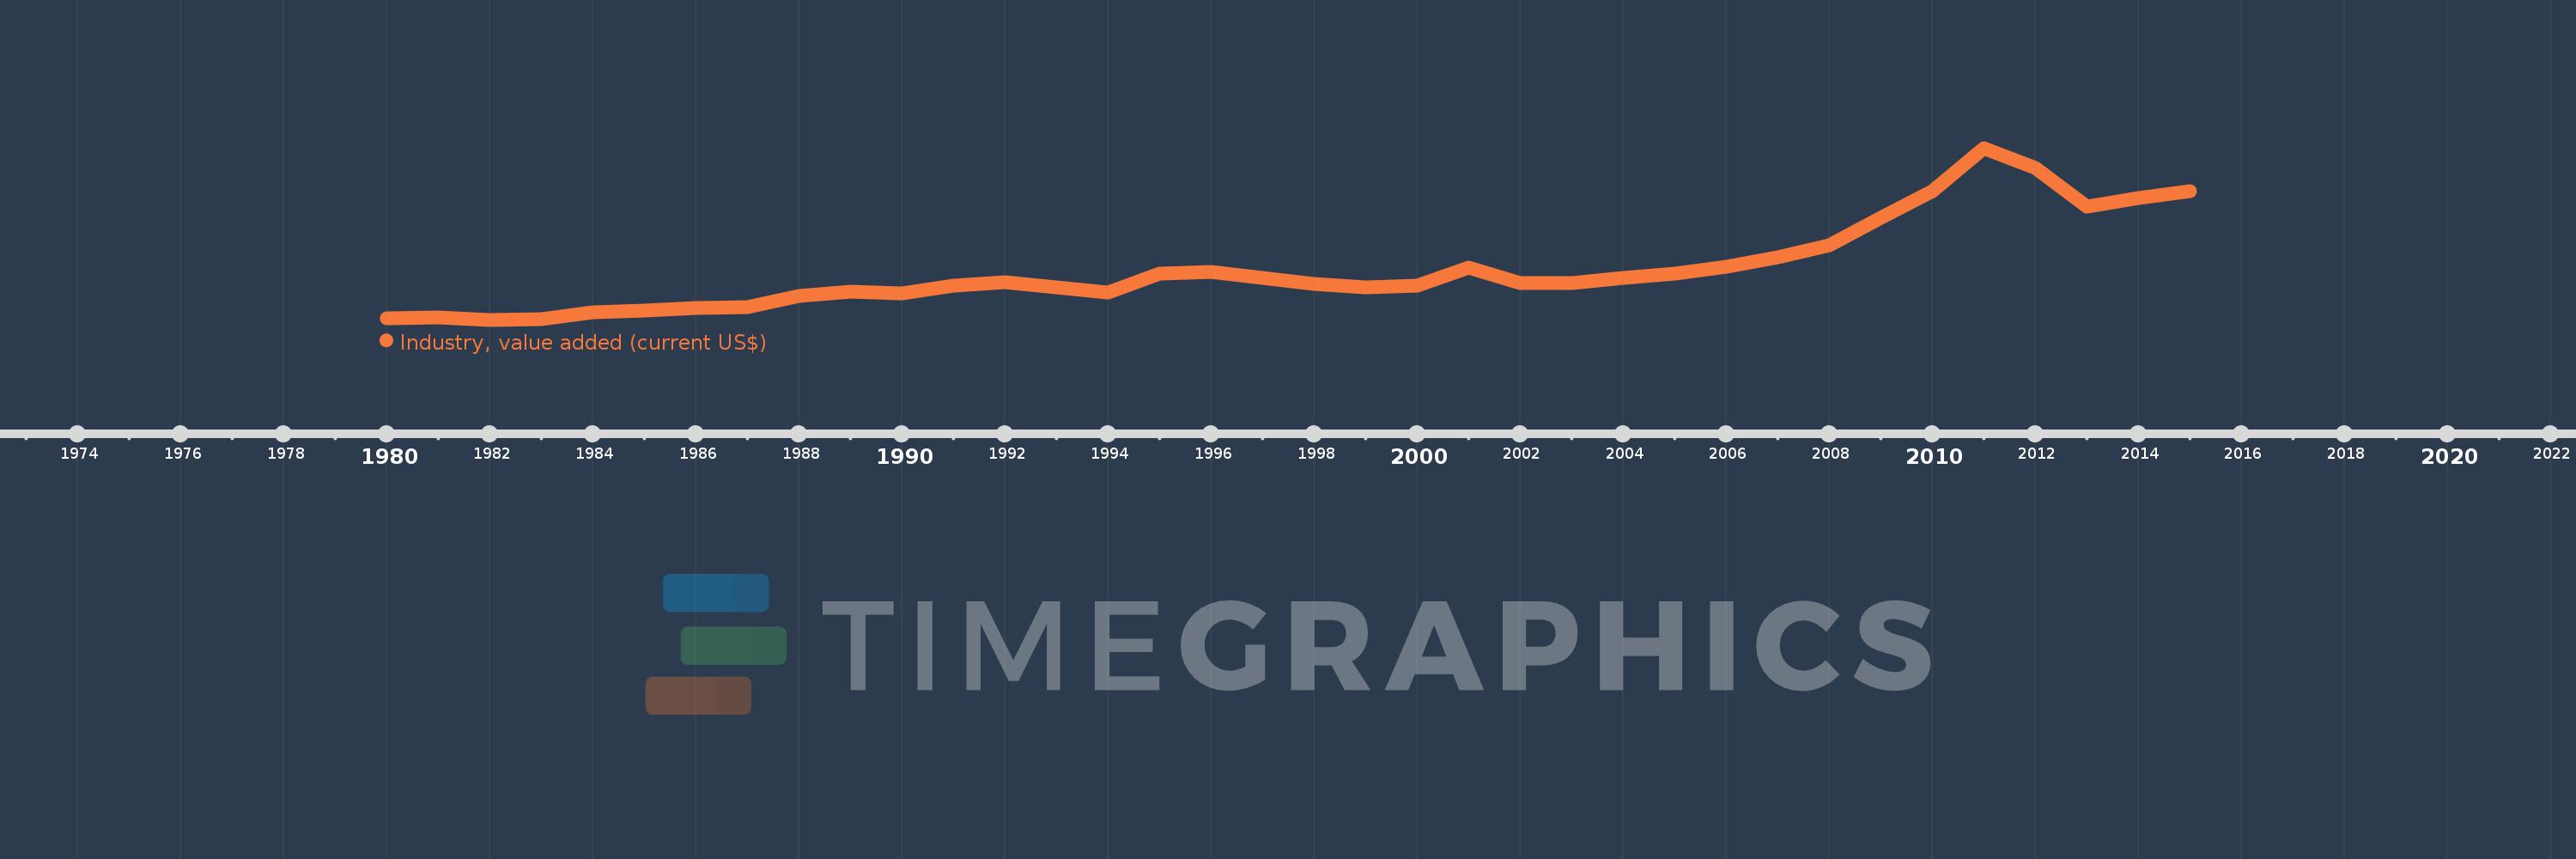
This timeline shows a graph from 1980 to 2015 of Vanuatu. No data until 1979. Number of actual observations by date: 36.
Source name:
World Development Indicators
Source organization:
World Bank national accounts data, and OECD National Accounts data files.
Categories, topics:
Economy & Growth
Last updated:
apr 23, 2017
Indicators value changes by year
Minimum:
6.386 mln
jan 1, 1982
Maximum:
86.311 mln
jan 1, 2011
At the date of observation
Value
Absolute change
Change from previous value
jan 1, 1980
7.214 mln
+7.214 mln
0.0%
jan 1, 1981
7.474 mln
+260.084K
3.61%
jan 1, 1982
6.386 mln
-1.087 mln
-14.55%
jan 1, 1983
6.597 mln
+210.672K
3.3%
jan 1, 1984
9.741 mln
+3.144 mln
47.66%
jan 1, 1985
10.692 mln
+950.96K
9.76%
jan 1, 1986
11.685 mln
+992.821K
9.29%
jan 1, 1987
12.122 mln
+437.079K
3.74%
jan 1, 1988
17.46 mln
+5.338 mln
44.04%
jan 1, 1989
19.583 mln
+2.123 mln
12.16%
jan 1, 1990
18.657 mln
-926.208K
-4.73%
jan 1, 1991
22.313 mln
+3.656 mln
19.6%
jan 1, 1992
24.024 mln
+1.711 mln
7.67%
jan 1, 1993
21.386 mln
-2.638 mln
-10.98%
jan 1, 1994
18.893 mln
-2.493 mln
-11.66%
jan 1, 1995
27.842 mln
+8.95 mln
47.37%
jan 1, 1996
28.623 mln
+780.971K
2.8%
jan 1, 1997
25.967 mln
-2.656 mln
-9.28%
jan 1, 1998
23.207 mln
-2.76 mln
-10.63%
jan 1, 1999
21.44 mln
-1.767 mln
-7.61%
jan 1, 2000
22.305 mln
+864.667K
4.03%
jan 1, 2001
30.528 mln
+8.223 mln
36.87%
jan 1, 2002
23.336 mln
-7.192 mln
-23.56%
jan 1, 2003
23.506 mln
+170.12K
0.73%
jan 1, 2004
25.763 mln
+2.257 mln
9.6%
jan 1, 2005
27.731 mln
+1.967 mln
7.64%
jan 1, 2006
30.994 mln
+3.264 mln
11.77%
jan 1, 2007
35.566 mln
+4.571 mln
14.75%
jan 1, 2008
41.049 mln
+5.484 mln
15.42%
jan 1, 2009
53.812 mln
+12.763 mln
31.09%
jan 1, 2010
66.348 mln
+12.536 mln
23.3%
jan 1, 2011
86.311 mln
+19.963 mln
30.09%
jan 1, 2012
76.976 mln
-9.334 mln
-10.81%
jan 1, 2013
58.885 mln
-18.091 mln
-23.5%
jan 1, 2014
63.062 mln
+4.176 mln
7.09%
jan 1, 2015
66.229 mln
+3.168 mln
5.02%
Ranking of countries by current statistics by years


Comments: