29
/
en
AIzaSyAYiBZKx7MnpbEhh9jyipgxe19OcubqV5w
April 1, 2024
213111
Nigeria
NGA
true
2
1
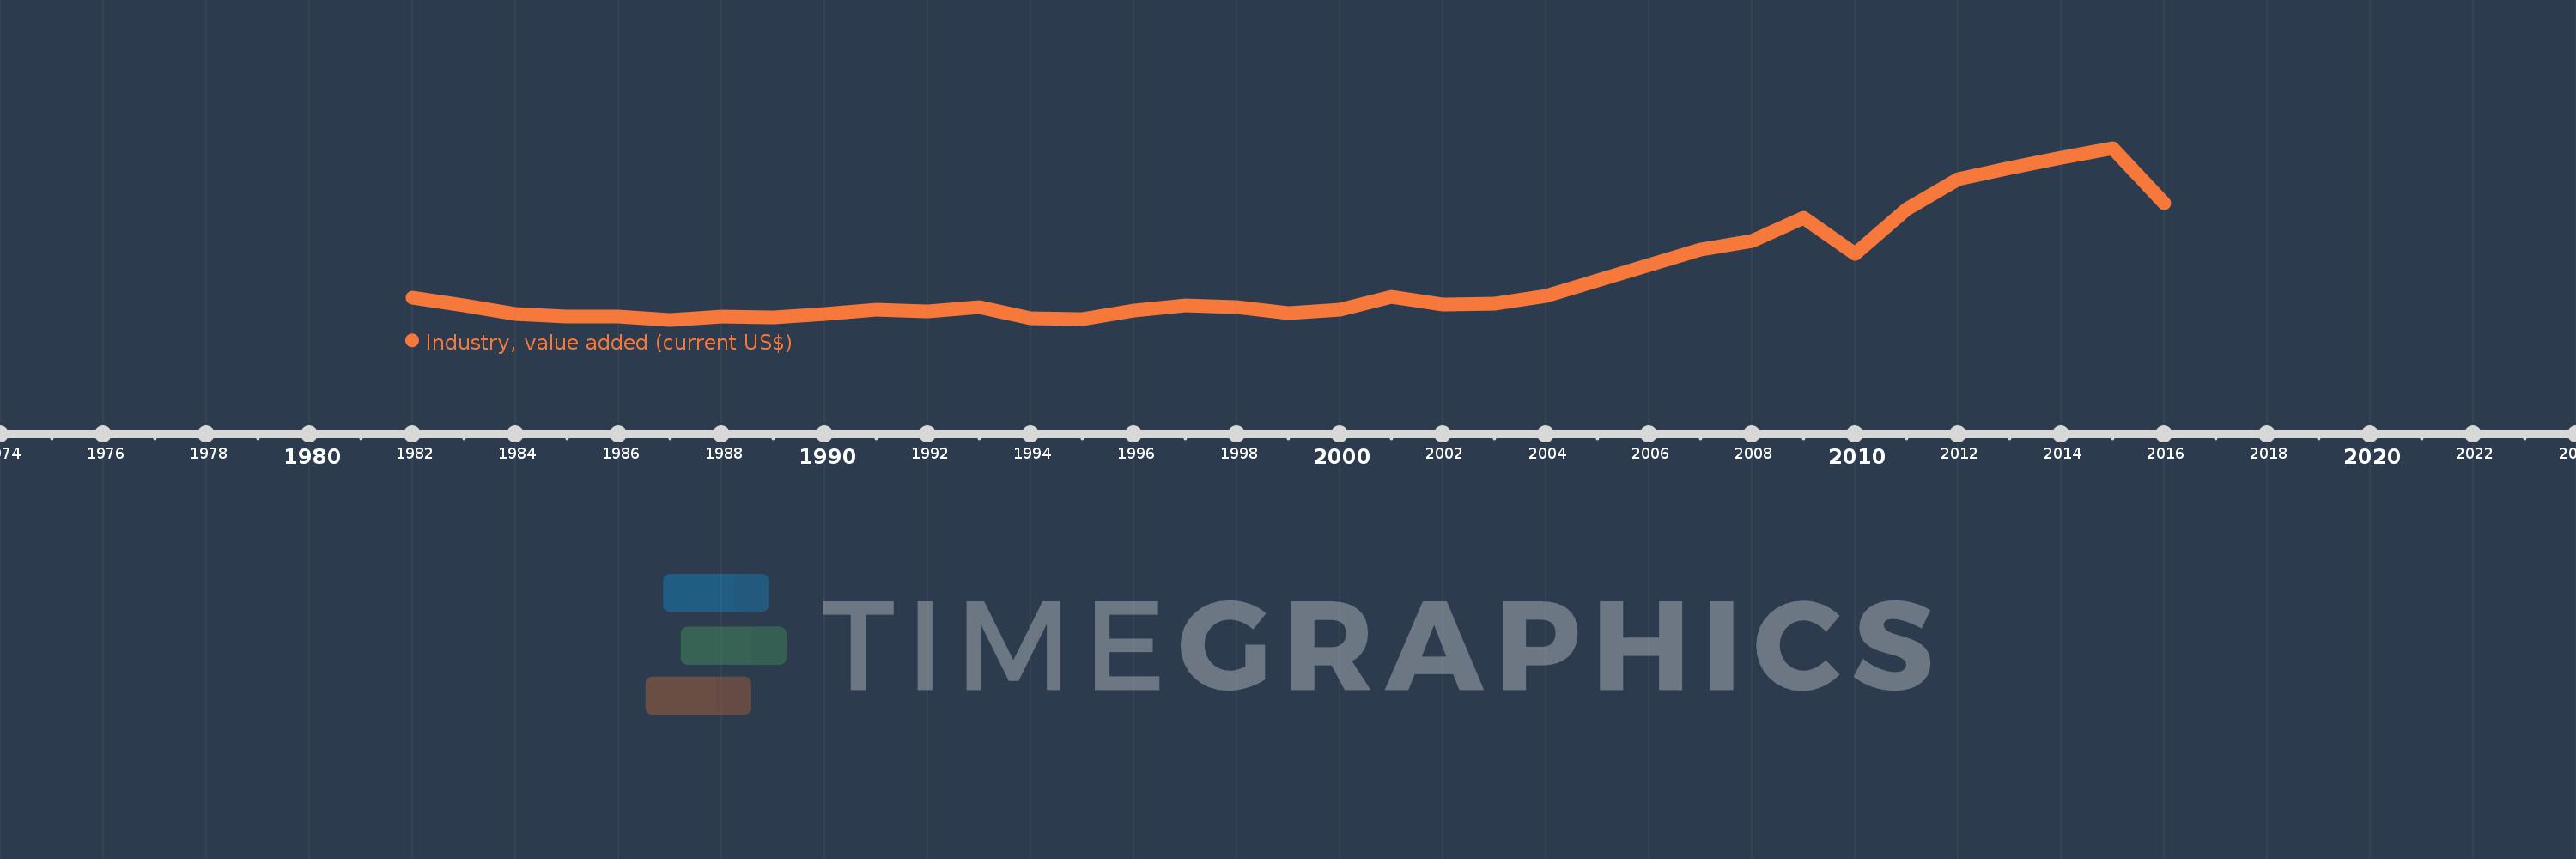
Industry, value added (current US$)
2016,2015,2014,2013,2012,2011,2010,2009,2008,2007,2006,2005,2004,2003,2002,2001,2000,1999,1998,1997,1996,1995,1994,1993,1992,1991,1990,1989,1988,1987,1986,1985,1984,1983,1982
This statistics in other country:
AfghanistanAlbaniaAlgeriaAndorraAngolaAntigua and BarbudaArab WorldArgentinaArmeniaArubaAustraliaAustriaAzerbaijanBahamas, TheBahrainBangladeshBarbadosBelarusBelgiumBelizeBeninBermudaBhutanBoliviaBosnia and HerzegovinaBotswanaBrazilBrunei DarussalamBulgariaBurkina FasoBurundiCabo VerdeCambodiaCameroonCanadaCaribbean small statesCayman IslandsCentral African RepublicCentral Europe and the BalticsChadChileChinaColombiaComorosCongo, Dem. Rep.Congo, Rep.Costa RicaCote d'IvoireCroatiaCubaCyprusCzech RepublicDenmarkDjiboutiDominicaDominican RepublicEarly-demographic dividendEast Asia & PacificEast Asia & Pacific (excluding high income)East Asia & Pacific (IDA & IBRD countries)EcuadorEgypt, Arab Rep.El SalvadorEquatorial GuineaEritreaEstoniaEthiopiaEuro areaEurope & Central AsiaEurope & Central Asia (excluding high income)Europe & Central Asia (IDA & IBRD countries)European UnionFijiFinlandFragile and conflict affected situationsFranceGabonGambia, TheGeorgiaGermanyGhanaGreeceGrenadaGuatemalaGuineaGuinea-BissauGuyanaHeavily indebted poor countries (HIPC)High incomeHondurasHong Kong SAR, ChinaHungaryIBRD onlyIcelandIDA & IBRD totalIDA blendIDA onlyIDA totalIndiaIndonesiaIran, Islamic Rep.IraqIrelandItalyJamaicaJapanJordanKazakhstanKenyaKiribatiKorea, Rep.KosovoKuwaitKyrgyz RepublicLao PDRLate-demographic dividendLatin America & Caribbean Latin America & Caribbean (excluding high income)Latin America & the Caribbean (IDA & IBRD countries)LatviaLeast developed countries: UN classificationLebanonLesothoLiberiaLibyaLiechtensteinLithuaniaLow & middle incomeLow incomeLower middle incomeLuxembourgMacao SAR, ChinaMacedonia, FYRMadagascarMalawiMalaysiaMaldivesMaliMaltaMarshall IslandsMauritaniaMauritiusMexicoMicronesia, Fed. Sts.Middle East & North AfricaMiddle East & North Africa (excluding high income)Middle East & North Africa (IDA & IBRD countries)Middle incomeMoldovaMongoliaMontenegroMoroccoMozambiqueMyanmarNamibiaNepalNetherlandsNew CaledoniaNew ZealandNicaraguaNigerNigeriaNorth AmericaNorwayOECD membersOmanOther small statesPacific island small statesPakistanPalauPanamaPapua New GuineaParaguayPeruPhilippinesPolandPortugalPost-demographic dividendPre-demographic dividendPuerto RicoQatarRomaniaRussian FederationRwandaSamoaSao Tome and PrincipeSaudi ArabiaSenegalSerbiaSeychellesSierra LeoneSingaporeSlovak RepublicSloveniaSmall statesSolomon IslandsSouth AfricaSouth AsiaSouth Asia (IDA & IBRD)SpainSri LankaSt. Kitts and NevisSt. LuciaSt. Vincent and the GrenadinesSub-Saharan Africa Sub-Saharan Africa (excluding high income)Sub-Saharan Africa (IDA & IBRD countries)SudanSurinameSwazilandSwedenSwitzerlandSyrian Arab RepublicTajikistanTanzaniaThailandTimor-LesteTogoTongaTrinidad and TobagoTunisiaTurkeyTurkmenistanTuvaluUgandaUkraineUnited Arab EmiratesUnited KingdomUnited StatesUpper middle incomeUruguayUzbekistanVanuatuVenezuela, RBVietnamWest Bank and GazaWorldYemen, Rep.ZambiaZimbabwe Timeline:
This timeline shows a graph from 1982 to 2016 of Nigeria. No data until 1981. Number of actual observations by date: 35.
Source name:
World Development Indicators
Source organization:
World Bank national accounts data, and OECD National Accounts data files.
Categories, topics:
Economy & Growth
Last updated:
apr 23, 2017
Indicators value changes by year
Minimum:
5.195 bln
jan 1, 1987
Maximum:
140.099 bln
jan 1, 2015
At the date of observation
Value
Absolute change
Change from previous value
jan 1, 1982
22.468 bln
+22.468 bln
0.0%
jan 1, 1983
16.663 bln
-5.805 bln
-25.84%
jan 1, 1984
10.029 bln
-6.634 bln
-39.82%
jan 1, 1985
7.484 bln
-2.544 bln
-25.37%
jan 1, 1986
7.961 bln
+477.291 mln
6.38%
jan 1, 1987
5.195 bln
-2.766 bln
-34.75%
jan 1, 1988
7.998 bln
+2.802 bln
53.94%
jan 1, 1989
6.955 bln
-1.042 bln
-13.03%
jan 1, 1990
10.025 bln
+3.07 bln
44.14%
jan 1, 1991
13.231 bln
+3.206 bln
31.98%
jan 1, 1992
11.889 bln
-1.342 bln
-10.14%
jan 1, 1993
14.89 bln
+3.001 bln
25.24%
jan 1, 1994
6.444 bln
-8.446 bln
-56.72%
jan 1, 1995
5.656 bln
-788.522 mln
-12.24%
jan 1, 1996
12.643 bln
+6.988 bln
123.55%
jan 1, 1997
16.391 bln
+3.748 bln
29.64%
jan 1, 1998
15.242 bln
-1.149 bln
-7.01%
jan 1, 1999
10.329 bln
-4.913 bln
-32.23%
jan 1, 2000
13.095 bln
+2.766 bln
26.78%
jan 1, 2001
23.522 bln
+10.427 bln
79.62%
jan 1, 2002
17.362 bln
-6.16 bln
-26.19%
jan 1, 2003
17.495 bln
+132.826 mln
0.77%
jan 1, 2004
24.137 bln
+6.642 bln
37.96%
jan 1, 2005
36.143 bln
+12.006 bln
49.74%
jan 1, 2006
48.296 bln
+12.153 bln
33.63%
jan 1, 2007
60.486 bln
+12.19 bln
25.24%
jan 1, 2008
66.749 bln
+6.263 bln
10.35%
jan 1, 2009
85.02 bln
+18.27 bln
27.37%
jan 1, 2010
56.956 bln
-28.063 bln
-33.01%
jan 1, 2011
91.993 bln
+35.037 bln
61.52%
jan 1, 2012
115.375 bln
+23.381 bln
25.42%
jan 1, 2013
124.368 bln
+8.993 bln
7.79%
jan 1, 2014
132.564 bln
+8.197 bln
6.59%
jan 1, 2015
140.099 bln
+7.534 bln
5.68%
jan 1, 2016
96.987 bln
-43.112 bln
-30.77%
Ranking of countries by current statistics by years


Comments: