29
/
en
AIzaSyAYiBZKx7MnpbEhh9jyipgxe19OcubqV5w
April 1, 2024
248869
Sri Lanka
LKA
true
2
1
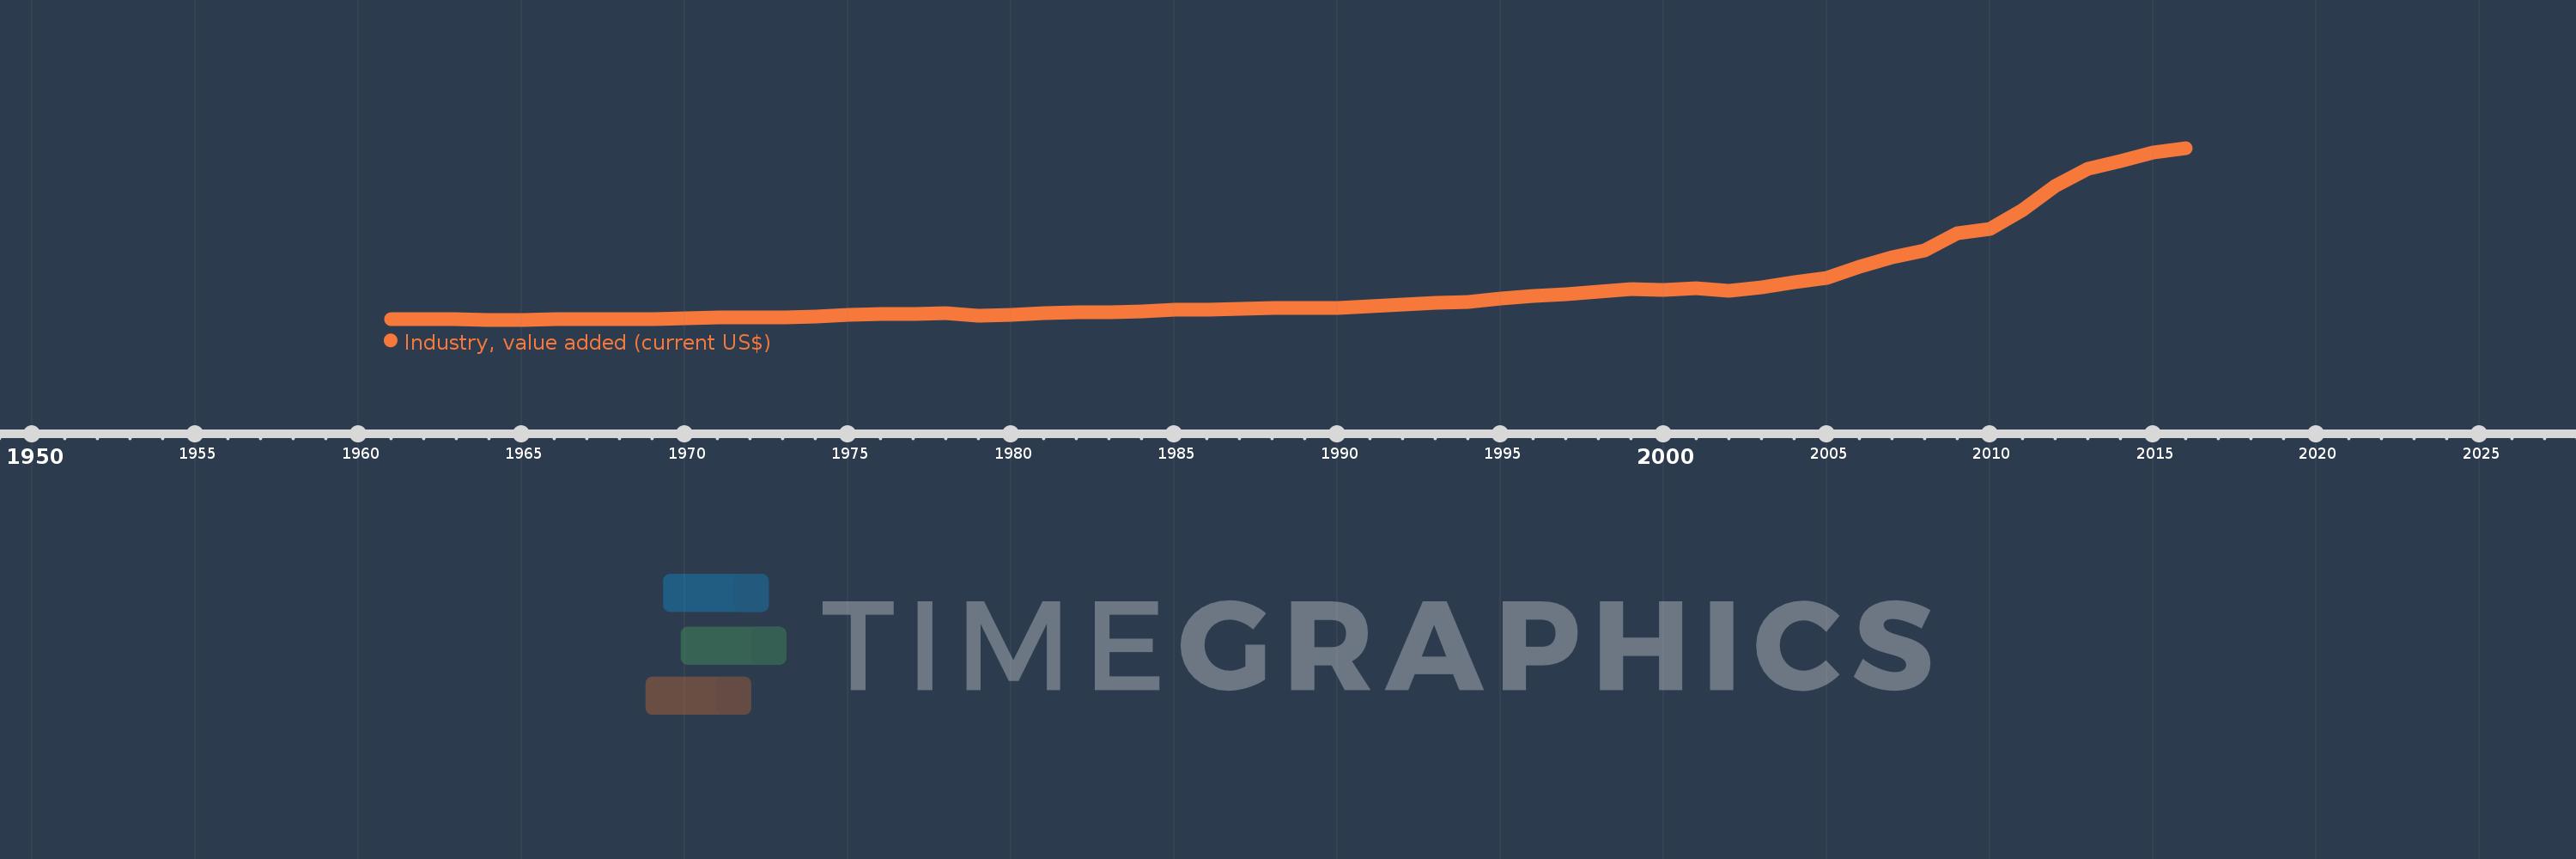
Industry, value added (current US$)
2016,2015,2014,2013,2012,2011,2010,2009,2008,2007,2006,2005,2004,2003,2002,2001,2000,1999,1998,1997,1996,1995,1994,1993,1992,1991,1990,1989,1988,1987,1986,1985,1984,1983,1982,1981,1980,1979,1978,1977,1976,1975,1974,1973,1972,1971,1970,1969,1968,1967,1966,1965,1964,1963,1962,1961
This statistics in other country:
AfghanistanAlbaniaAlgeriaAndorraAngolaAntigua and BarbudaArab WorldArgentinaArmeniaArubaAustraliaAustriaAzerbaijanBahamas, TheBahrainBangladeshBarbadosBelarusBelgiumBelizeBeninBermudaBhutanBoliviaBosnia and HerzegovinaBotswanaBrazilBrunei DarussalamBulgariaBurkina FasoBurundiCabo VerdeCambodiaCameroonCanadaCaribbean small statesCayman IslandsCentral African RepublicCentral Europe and the BalticsChadChileChinaColombiaComorosCongo, Dem. Rep.Congo, Rep.Costa RicaCote d'IvoireCroatiaCubaCyprusCzech RepublicDenmarkDjiboutiDominicaDominican RepublicEarly-demographic dividendEast Asia & PacificEast Asia & Pacific (excluding high income)East Asia & Pacific (IDA & IBRD countries)EcuadorEgypt, Arab Rep.El SalvadorEquatorial GuineaEritreaEstoniaEthiopiaEuro areaEurope & Central AsiaEurope & Central Asia (excluding high income)Europe & Central Asia (IDA & IBRD countries)European UnionFijiFinlandFragile and conflict affected situationsFranceGabonGambia, TheGeorgiaGermanyGhanaGreeceGrenadaGuatemalaGuineaGuinea-BissauGuyanaHeavily indebted poor countries (HIPC)High incomeHondurasHong Kong SAR, ChinaHungaryIBRD onlyIcelandIDA & IBRD totalIDA blendIDA onlyIDA totalIndiaIndonesiaIran, Islamic Rep.IraqIrelandItalyJamaicaJapanJordanKazakhstanKenyaKiribatiKorea, Rep.KosovoKuwaitKyrgyz RepublicLao PDRLate-demographic dividendLatin America & Caribbean Latin America & Caribbean (excluding high income)Latin America & the Caribbean (IDA & IBRD countries)LatviaLeast developed countries: UN classificationLebanonLesothoLiberiaLibyaLiechtensteinLithuaniaLow & middle incomeLow incomeLower middle incomeLuxembourgMacao SAR, ChinaMacedonia, FYRMadagascarMalawiMalaysiaMaldivesMaliMaltaMarshall IslandsMauritaniaMauritiusMexicoMicronesia, Fed. Sts.Middle East & North AfricaMiddle East & North Africa (excluding high income)Middle East & North Africa (IDA & IBRD countries)Middle incomeMoldovaMongoliaMontenegroMoroccoMozambiqueMyanmarNamibiaNepalNetherlandsNew CaledoniaNew ZealandNicaraguaNigerNigeriaNorth AmericaNorwayOECD membersOmanOther small statesPacific island small statesPakistanPalauPanamaPapua New GuineaParaguayPeruPhilippinesPolandPortugalPost-demographic dividendPre-demographic dividendPuerto RicoQatarRomaniaRussian FederationRwandaSamoaSao Tome and PrincipeSaudi ArabiaSenegalSerbiaSeychellesSierra LeoneSingaporeSlovak RepublicSloveniaSmall statesSolomon IslandsSouth AfricaSouth AsiaSouth Asia (IDA & IBRD)SpainSri LankaSt. Kitts and NevisSt. LuciaSt. Vincent and the GrenadinesSub-Saharan Africa Sub-Saharan Africa (excluding high income)Sub-Saharan Africa (IDA & IBRD countries)SudanSurinameSwazilandSwedenSwitzerlandSyrian Arab RepublicTajikistanTanzaniaThailandTimor-LesteTogoTongaTrinidad and TobagoTunisiaTurkeyTurkmenistanTuvaluUgandaUkraineUnited Arab EmiratesUnited KingdomUnited StatesUpper middle incomeUruguayUzbekistanVanuatuVenezuela, RBVietnamWest Bank and GazaWorldYemen, Rep.ZambiaZimbabwe Timeline:
This timeline shows a graph from 1961 to 2016 of Sri Lanka. No data until 1960. Number of actual observations by date: 56.
Source name:
World Development Indicators
Source organization:
World Bank national accounts data, and OECD National Accounts data files.
Categories, topics:
Economy & Growth
Last updated:
apr 23, 2017
Indicators value changes by year
Minimum:
256.729 mln
jan 1, 1964
Maximum:
23.481 bln
jan 1, 2016
At the date of observation
Value
Absolute change
Change from previous value
jan 1, 1961
291.663 mln
+291.663 mln
0.0%
jan 1, 1962
296.875 mln
+5.212 mln
1.79%
jan 1, 1963
302.409 mln
+5.534 mln
1.86%
jan 1, 1964
256.729 mln
-45.68 mln
-15.11%
jan 1, 1965
267.075 mln
+10.346 mln
4.03%
jan 1, 1966
366.031 mln
+98.955 mln
37.05%
jan 1, 1967
355.87 mln
-10.161 mln
-2.78%
jan 1, 1968
371.776 mln
+15.907 mln
4.47%
jan 1, 1969
386.519 mln
+14.742 mln
3.97%
jan 1, 1970
457.492 mln
+70.974 mln
18.36%
jan 1, 1971
555.316 mln
+97.823 mln
21.38%
jan 1, 1972
594.043 mln
+38.728 mln
6.97%
jan 1, 1973
627.244 mln
+33.201 mln
5.59%
jan 1, 1974
739.874 mln
+112.63 mln
17.96%
jan 1, 1975
905.864 mln
+165.99 mln
22.43%
jan 1, 1976
1.012 bln
+105.941 mln
11.7%
jan 1, 1977
983.211 mln
-28.594 mln
-2.83%
jan 1, 1978
1.188 bln
+204.777 mln
20.83%
jan 1, 1979
752.579 mln
-435.409 mln
-36.65%
jan 1, 1980
959.782 mln
+207.203 mln
27.53%
jan 1, 1981
1.204 bln
+244.582 mln
25.48%
jan 1, 1982
1.248 bln
+43.242 mln
3.59%
jan 1, 1983
1.265 bln
+16.946 mln
1.36%
jan 1, 1984
1.372 bln
+107.003 mln
8.46%
jan 1, 1985
1.601 bln
+229.78 mln
16.75%
jan 1, 1986
1.587 bln
-14.196 mln
-0.89%
jan 1, 1987
1.727 bln
+139.415 mln
8.78%
jan 1, 1988
1.856 bln
+129.807 mln
7.52%
jan 1, 1989
1.886 bln
+30.038 mln
1.62%
jan 1, 1990
1.894 bln
+7.219 mln
0.38%
jan 1, 1991
2.115 bln
+221.159 mln
11.68%
jan 1, 1992
2.331 bln
+215.919 mln
10.21%
jan 1, 1993
2.512 bln
+181.368 mln
7.78%
jan 1, 1994
2.673 bln
+160.437 mln
6.39%
jan 1, 1995
3.094 bln
+421.437 mln
15.77%
jan 1, 1996
3.477 bln
+382.903 mln
12.38%
jan 1, 1997
3.693 bln
+216.375 mln
6.22%
jan 1, 1998
4.074 bln
+380.644 mln
10.31%
jan 1, 1999
4.362 bln
+288.192 mln
7.07%
jan 1, 2000
4.284 bln
-78.274 mln
-1.79%
jan 1, 2001
4.461 bln
+177.486 mln
4.14%
jan 1, 2002
4.223 bln
-238.032 mln
-5.34%
jan 1, 2003
4.632 bln
+408.753 mln
9.68%
jan 1, 2004
5.367 bln
+735.076 mln
15.87%
jan 1, 2005
5.913 bln
+546.162 mln
10.18%
jan 1, 2006
7.368 bln
+1.455 bln
24.6%
jan 1, 2007
8.666 bln
+1.298 bln
17.61%
jan 1, 2008
9.679 bln
+1.014 bln
11.7%
jan 1, 2009
11.958 bln
+2.279 bln
23.55%
jan 1, 2010
12.482 bln
+523.519 mln
4.38%
jan 1, 2011
15.114 bln
+2.632 bln
21.09%
jan 1, 2012
18.279 bln
+3.165 bln
20.94%
jan 1, 2013
20.617 bln
+2.338 bln
12.79%
jan 1, 2014
21.673 bln
+1.056 bln
5.12%
jan 1, 2015
22.871 bln
+1.198 bln
5.53%
jan 1, 2016
23.481 bln
+609.221 mln
2.66%
Ranking of countries by current statistics by years


Comments: