29
/
en
AIzaSyAYiBZKx7MnpbEhh9jyipgxe19OcubqV5w
April 1, 2024
190391
Mali
MLI
true
2
1
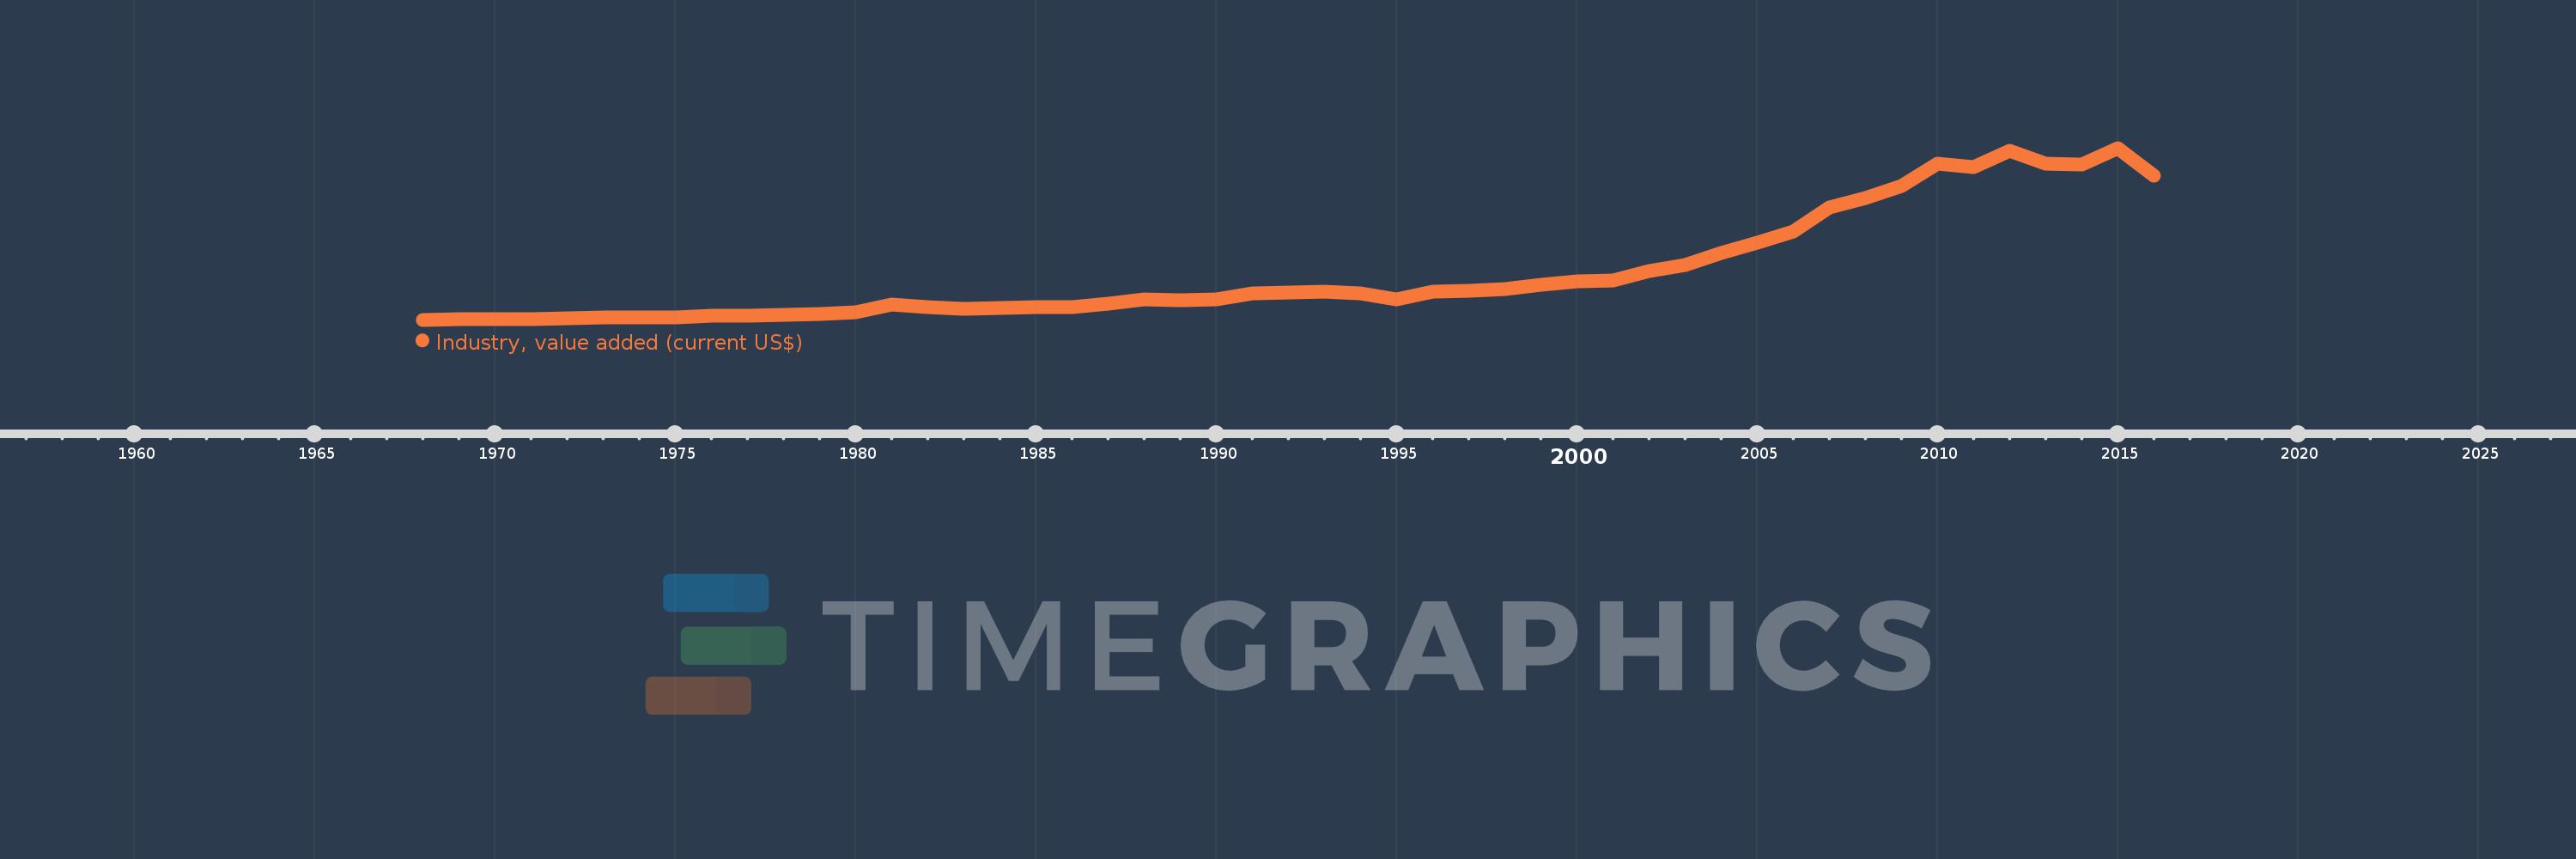
Industry, value added (current US$)
2016,2015,2014,2013,2012,2011,2010,2009,2008,2007,2006,2005,2004,2003,2002,2001,2000,1999,1998,1997,1996,1995,1994,1993,1992,1991,1990,1989,1988,1987,1986,1985,1984,1983,1982,1981,1980,1979,1978,1977,1976,1975,1974,1973,1972,1971,1970,1969,1968
This statistics in other country:
AfghanistanAlbaniaAlgeriaAndorraAngolaAntigua and BarbudaArab WorldArgentinaArmeniaArubaAustraliaAustriaAzerbaijanBahamas, TheBahrainBangladeshBarbadosBelarusBelgiumBelizeBeninBermudaBhutanBoliviaBosnia and HerzegovinaBotswanaBrazilBrunei DarussalamBulgariaBurkina FasoBurundiCabo VerdeCambodiaCameroonCanadaCaribbean small statesCayman IslandsCentral African RepublicCentral Europe and the BalticsChadChileChinaColombiaComorosCongo, Dem. Rep.Congo, Rep.Costa RicaCote d'IvoireCroatiaCubaCyprusCzech RepublicDenmarkDjiboutiDominicaDominican RepublicEarly-demographic dividendEast Asia & PacificEast Asia & Pacific (excluding high income)East Asia & Pacific (IDA & IBRD countries)EcuadorEgypt, Arab Rep.El SalvadorEquatorial GuineaEritreaEstoniaEthiopiaEuro areaEurope & Central AsiaEurope & Central Asia (excluding high income)Europe & Central Asia (IDA & IBRD countries)European UnionFijiFinlandFragile and conflict affected situationsFranceGabonGambia, TheGeorgiaGermanyGhanaGreeceGrenadaGuatemalaGuineaGuinea-BissauGuyanaHeavily indebted poor countries (HIPC)High incomeHondurasHong Kong SAR, ChinaHungaryIBRD onlyIcelandIDA & IBRD totalIDA blendIDA onlyIDA totalIndiaIndonesiaIran, Islamic Rep.IraqIrelandItalyJamaicaJapanJordanKazakhstanKenyaKiribatiKorea, Rep.KosovoKuwaitKyrgyz RepublicLao PDRLate-demographic dividendLatin America & Caribbean Latin America & Caribbean (excluding high income)Latin America & the Caribbean (IDA & IBRD countries)LatviaLeast developed countries: UN classificationLebanonLesothoLiberiaLibyaLiechtensteinLithuaniaLow & middle incomeLow incomeLower middle incomeLuxembourgMacao SAR, ChinaMacedonia, FYRMadagascarMalawiMalaysiaMaldivesMaliMaltaMarshall IslandsMauritaniaMauritiusMexicoMicronesia, Fed. Sts.Middle East & North AfricaMiddle East & North Africa (excluding high income)Middle East & North Africa (IDA & IBRD countries)Middle incomeMoldovaMongoliaMontenegroMoroccoMozambiqueMyanmarNamibiaNepalNetherlandsNew CaledoniaNew ZealandNicaraguaNigerNigeriaNorth AmericaNorwayOECD membersOmanOther small statesPacific island small statesPakistanPalauPanamaPapua New GuineaParaguayPeruPhilippinesPolandPortugalPost-demographic dividendPre-demographic dividendPuerto RicoQatarRomaniaRussian FederationRwandaSamoaSao Tome and PrincipeSaudi ArabiaSenegalSerbiaSeychellesSierra LeoneSingaporeSlovak RepublicSloveniaSmall statesSolomon IslandsSouth AfricaSouth AsiaSouth Asia (IDA & IBRD)SpainSri LankaSt. Kitts and NevisSt. LuciaSt. Vincent and the GrenadinesSub-Saharan Africa Sub-Saharan Africa (excluding high income)Sub-Saharan Africa (IDA & IBRD countries)SudanSurinameSwazilandSwedenSwitzerlandSyrian Arab RepublicTajikistanTanzaniaThailandTimor-LesteTogoTongaTrinidad and TobagoTunisiaTurkeyTurkmenistanTuvaluUgandaUkraineUnited Arab EmiratesUnited KingdomUnited StatesUpper middle incomeUruguayUzbekistanVanuatuVenezuela, RBVietnamWest Bank and GazaWorldYemen, Rep.ZambiaZimbabwe Timeline:
This timeline shows a graph from 1968 to 2016 of Mali. No data until 1967. Number of actual observations by date: 49.
Source name:
World Development Indicators
Source organization:
World Bank national accounts data, and OECD National Accounts data files.
Categories, topics:
Economy & Growth
Last updated:
apr 23, 2017
Indicators value changes by year
Minimum:
24.289 mln
jan 1, 1968
Maximum:
2.724 bln
jan 1, 2015
At the date of observation
Value
Absolute change
Change from previous value
jan 1, 1968
24.289 mln
+24.289 mln
0.0%
jan 1, 1969
35.563 mln
+11.274 mln
46.42%
jan 1, 1970
34.152 mln
-1.411 mln
-3.97%
jan 1, 1971
36.796 mln
+2.645 mln
7.74%
jan 1, 1972
46.761 mln
+9.965 mln
27.08%
jan 1, 1973
55.037 mln
+8.275 mln
17.7%
jan 1, 1974
66.018 mln
+10.981 mln
19.95%
jan 1, 1975
66.773 mln
+755.546K
1.14%
jan 1, 1976
84.155 mln
+17.381 mln
26.03%
jan 1, 1977
92.306 mln
+8.151 mln
9.69%
jan 1, 1978
103.555 mln
+11.249 mln
12.19%
jan 1, 1979
119.978 mln
+16.423 mln
15.86%
jan 1, 1980
140.876 mln
+20.898 mln
17.42%
jan 1, 1981
257.07 mln
+116.194 mln
82.48%
jan 1, 1982
220.865 mln
-36.205 mln
-14.08%
jan 1, 1983
189.866 mln
-30.998 mln
-14.04%
jan 1, 1984
210.296 mln
+20.429 mln
10.76%
jan 1, 1985
222.016 mln
+11.72 mln
5.57%
jan 1, 1986
216.356 mln
-5.66 mln
-2.55%
jan 1, 1987
279.576 mln
+63.22 mln
29.22%
jan 1, 1988
344.478 mln
+64.902 mln
23.21%
jan 1, 1989
328.238 mln
-16.24 mln
-4.71%
jan 1, 1990
348.073 mln
+19.835 mln
6.04%
jan 1, 1991
438.083 mln
+90.01 mln
25.86%
jan 1, 1992
453.753 mln
+15.67 mln
3.58%
jan 1, 1993
459.702 mln
+5.95 mln
1.31%
jan 1, 1994
438.979 mln
-20.723 mln
-4.51%
jan 1, 1995
346.799 mln
-92.18 mln
-21.0%
jan 1, 1996
470.984 mln
+124.185 mln
35.81%
jan 1, 1997
474.419 mln
+3.436 mln
0.73%
jan 1, 1998
506.702 mln
+32.283 mln
6.8%
jan 1, 1999
567.414 mln
+60.712 mln
11.98%
jan 1, 2000
626.888 mln
+59.474 mln
10.48%
jan 1, 2001
635.757 mln
+8.868 mln
1.41%
jan 1, 2002
785.597 mln
+149.84 mln
23.57%
jan 1, 2003
879.129 mln
+93.532 mln
11.91%
jan 1, 2004
1.07 bln
+191.352 mln
21.77%
jan 1, 2005
1.231 bln
+160.537 mln
15.0%
jan 1, 2006
1.413 bln
+182.349 mln
14.81%
jan 1, 2007
1.784 bln
+370.157 mln
26.19%
jan 1, 2008
1.935 bln
+151.732 mln
8.51%
jan 1, 2009
2.127 bln
+191.856 mln
9.91%
jan 1, 2010
2.483 bln
+356.126 mln
16.74%
jan 1, 2011
2.428 bln
-55.526 mln
-2.24%
jan 1, 2012
2.68 bln
+252.148 mln
10.39%
jan 1, 2013
2.472 bln
-207.834 mln
-7.76%
jan 1, 2014
2.467 bln
-5.102 mln
-0.21%
jan 1, 2015
2.724 bln
+257.08 mln
10.42%
jan 1, 2016
2.292 bln
-431.848 mln
-15.85%
Ranking of countries by current statistics by years


Comments: