29
/
en
AIzaSyAYiBZKx7MnpbEhh9jyipgxe19OcubqV5w
April 1, 2024
239441
Sierra Leone
SLE
true
2
1
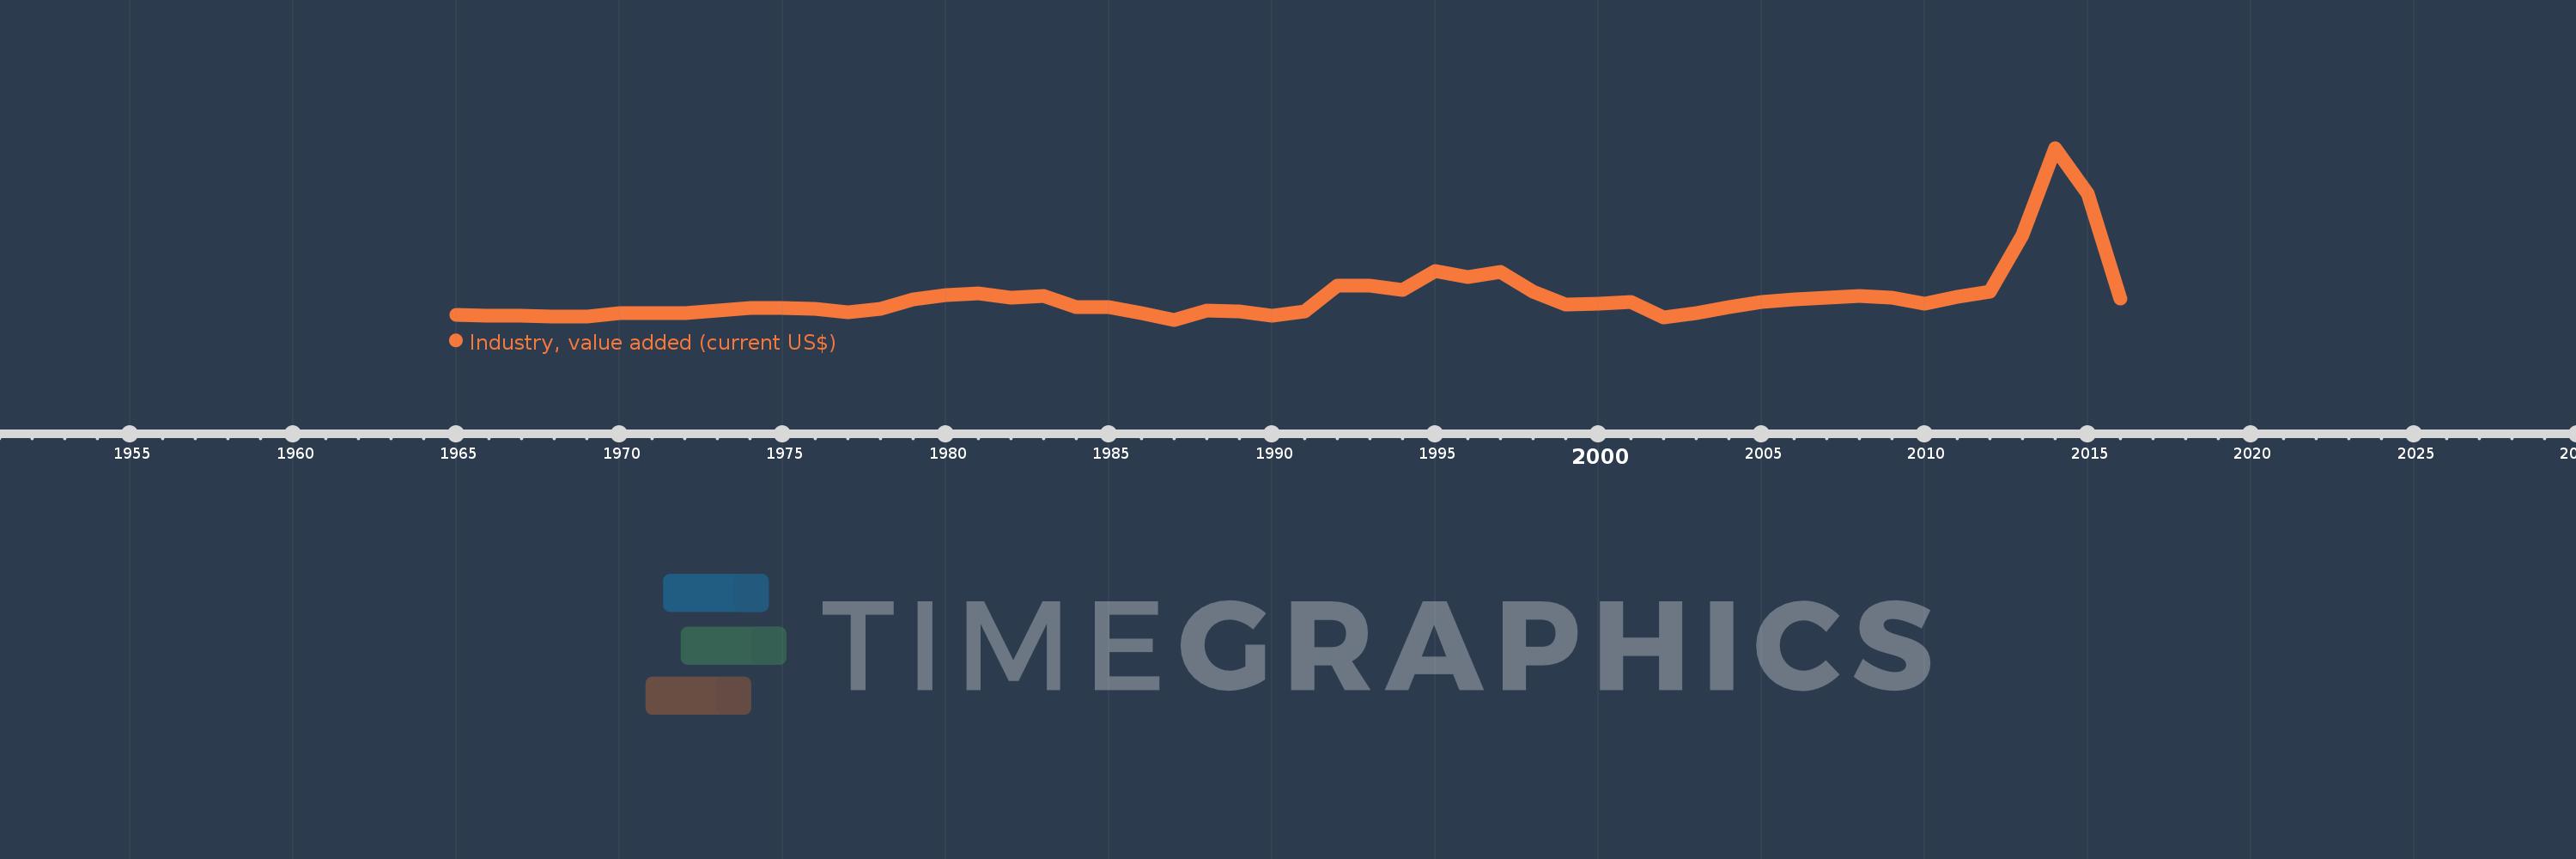
Industry, value added (current US$)
2016,2015,2014,2013,2012,2011,2010,2009,2008,2007,2006,2005,2004,2003,2002,2001,2000,1999,1998,1997,1996,1995,1994,1993,1992,1991,1990,1989,1988,1987,1986,1985,1984,1983,1982,1981,1980,1979,1978,1977,1976,1975,1974,1973,1972,1971,1970,1969,1968,1967,1966,1965
This statistics in other country:
AfghanistanAlbaniaAlgeriaAndorraAngolaAntigua and BarbudaArab WorldArgentinaArmeniaArubaAustraliaAustriaAzerbaijanBahamas, TheBahrainBangladeshBarbadosBelarusBelgiumBelizeBeninBermudaBhutanBoliviaBosnia and HerzegovinaBotswanaBrazilBrunei DarussalamBulgariaBurkina FasoBurundiCabo VerdeCambodiaCameroonCanadaCaribbean small statesCayman IslandsCentral African RepublicCentral Europe and the BalticsChadChileChinaColombiaComorosCongo, Dem. Rep.Congo, Rep.Costa RicaCote d'IvoireCroatiaCubaCyprusCzech RepublicDenmarkDjiboutiDominicaDominican RepublicEarly-demographic dividendEast Asia & PacificEast Asia & Pacific (excluding high income)East Asia & Pacific (IDA & IBRD countries)EcuadorEgypt, Arab Rep.El SalvadorEquatorial GuineaEritreaEstoniaEthiopiaEuro areaEurope & Central AsiaEurope & Central Asia (excluding high income)Europe & Central Asia (IDA & IBRD countries)European UnionFijiFinlandFragile and conflict affected situationsFranceGabonGambia, TheGeorgiaGermanyGhanaGreeceGrenadaGuatemalaGuineaGuinea-BissauGuyanaHeavily indebted poor countries (HIPC)High incomeHondurasHong Kong SAR, ChinaHungaryIBRD onlyIcelandIDA & IBRD totalIDA blendIDA onlyIDA totalIndiaIndonesiaIran, Islamic Rep.IraqIrelandItalyJamaicaJapanJordanKazakhstanKenyaKiribatiKorea, Rep.KosovoKuwaitKyrgyz RepublicLao PDRLate-demographic dividendLatin America & Caribbean Latin America & Caribbean (excluding high income)Latin America & the Caribbean (IDA & IBRD countries)LatviaLeast developed countries: UN classificationLebanonLesothoLiberiaLibyaLiechtensteinLithuaniaLow & middle incomeLow incomeLower middle incomeLuxembourgMacao SAR, ChinaMacedonia, FYRMadagascarMalawiMalaysiaMaldivesMaliMaltaMarshall IslandsMauritaniaMauritiusMexicoMicronesia, Fed. Sts.Middle East & North AfricaMiddle East & North Africa (excluding high income)Middle East & North Africa (IDA & IBRD countries)Middle incomeMoldovaMongoliaMontenegroMoroccoMozambiqueMyanmarNamibiaNepalNetherlandsNew CaledoniaNew ZealandNicaraguaNigerNigeriaNorth AmericaNorwayOECD membersOmanOther small statesPacific island small statesPakistanPalauPanamaPapua New GuineaParaguayPeruPhilippinesPolandPortugalPost-demographic dividendPre-demographic dividendPuerto RicoQatarRomaniaRussian FederationRwandaSamoaSao Tome and PrincipeSaudi ArabiaSenegalSerbiaSeychellesSierra LeoneSingaporeSlovak RepublicSloveniaSmall statesSolomon IslandsSouth AfricaSouth AsiaSouth Asia (IDA & IBRD)SpainSri LankaSt. Kitts and NevisSt. LuciaSt. Vincent and the GrenadinesSub-Saharan Africa Sub-Saharan Africa (excluding high income)Sub-Saharan Africa (IDA & IBRD countries)SudanSurinameSwazilandSwedenSwitzerlandSyrian Arab RepublicTajikistanTanzaniaThailandTimor-LesteTogoTongaTrinidad and TobagoTunisiaTurkeyTurkmenistanTuvaluUgandaUkraineUnited Arab EmiratesUnited KingdomUnited StatesUpper middle incomeUruguayUzbekistanVanuatuVenezuela, RBVietnamWest Bank and GazaWorldYemen, Rep.ZambiaZimbabwe Timeline:
This timeline shows a graph from 1965 to 2016 of Sierra Leone. No data until 1964. Number of actual observations by date: 52.
Source name:
World Development Indicators
Source organization:
World Bank national accounts data, and OECD National Accounts data files.
Categories, topics:
Economy & Growth
Last updated:
apr 23, 2017
Indicators value changes by year
Minimum:
71.892 mln
jan 1, 1987
Maximum:
1.045 bln
jan 1, 2014
At the date of observation
Value
Absolute change
Change from previous value
jan 1, 1965
98.639 mln
+98.639 mln
0.0%
jan 1, 1966
96.46 mln
-2.179 mln
-2.21%
jan 1, 1967
93.66 mln
-2.8 mln
-2.9%
jan 1, 1968
91.203 mln
-2.457 mln
-2.62%
jan 1, 1969
91.56 mln
+356.831K
0.39%
jan 1, 1970
107.28 mln
+15.72 mln
17.17%
jan 1, 1971
110.34 mln
+3.06 mln
2.85%
jan 1, 1972
110.002 mln
-338.046K
-0.31%
jan 1, 1973
125.377 mln
+15.375 mln
13.98%
jan 1, 1974
140.199 mln
+14.821 mln
11.82%
jan 1, 1975
139.749 mln
-449.382K
-0.32%
jan 1, 1976
132.685 mln
-7.064 mln
-5.06%
jan 1, 1977
115.65 mln
-17.035 mln
-12.84%
jan 1, 1978
134.496 mln
+18.846 mln
16.3%
jan 1, 1979
186.621 mln
+52.125 mln
38.76%
jan 1, 1980
212.92 mln
+26.299 mln
14.09%
jan 1, 1981
221.947 mln
+9.027 mln
4.24%
jan 1, 1982
199.293 mln
-22.654 mln
-10.21%
jan 1, 1983
206.677 mln
+7.384 mln
3.71%
jan 1, 1984
141.089 mln
-65.587 mln
-31.73%
jan 1, 1985
142.632 mln
+1.543 mln
1.09%
jan 1, 1986
111.043 mln
-31.59 mln
-22.15%
jan 1, 1987
71.892 mln
-39.151 mln
-35.26%
jan 1, 1988
125.738 mln
+53.846 mln
74.9%
jan 1, 1989
119.216 mln
-6.522 mln
-5.19%
jan 1, 1990
94.838 mln
-24.378 mln
-20.45%
jan 1, 1991
116.737 mln
+21.9 mln
23.09%
jan 1, 1992
263.565 mln
+146.828 mln
125.78%
jan 1, 1993
263.889 mln
+324.447K
0.12%
jan 1, 1994
239.214 mln
-24.675 mln
-9.35%
jan 1, 1995
349.789 mln
+110.575 mln
46.22%
jan 1, 1996
314.056 mln
-35.733 mln
-10.22%
jan 1, 1997
341.883 mln
+27.827 mln
8.86%
jan 1, 1998
230.361 mln
-111.522 mln
-32.62%
jan 1, 1999
159.707 mln
-70.654 mln
-30.67%
jan 1, 2000
162.698 mln
+2.991 mln
1.87%
jan 1, 2001
170.155 mln
+7.457 mln
4.58%
jan 1, 2002
86.207 mln
-83.948 mln
-49.34%
jan 1, 2003
110.374 mln
+24.167 mln
28.03%
jan 1, 2004
143.324 mln
+32.951 mln
29.85%
jan 1, 2005
170.593 mln
+27.268 mln
19.03%
jan 1, 2006
185.801 mln
+15.209 mln
8.92%
jan 1, 2007
198.332 mln
+12.531 mln
6.74%
jan 1, 2008
208.1 mln
+9.768 mln
4.93%
jan 1, 2009
196.283 mln
-11.817 mln
-5.68%
jan 1, 2010
160.662 mln
-35.621 mln
-18.15%
jan 1, 2011
200.606 mln
+39.944 mln
24.86%
jan 1, 2012
231.568 mln
+30.962 mln
15.43%
jan 1, 2013
552.577 mln
+321.009 mln
138.62%
jan 1, 2014
1.045 bln
+491.939 mln
89.03%
jan 1, 2015
783.07 mln
-261.446 mln
-25.03%
jan 1, 2016
192.022 mln
-591.048 mln
-75.48%
Ranking of countries by current statistics by years


Comments: