29
/
en
AIzaSyAYiBZKx7MnpbEhh9jyipgxe19OcubqV5w
April 1, 2024
94044
Bulgaria
BGR
true
2
1
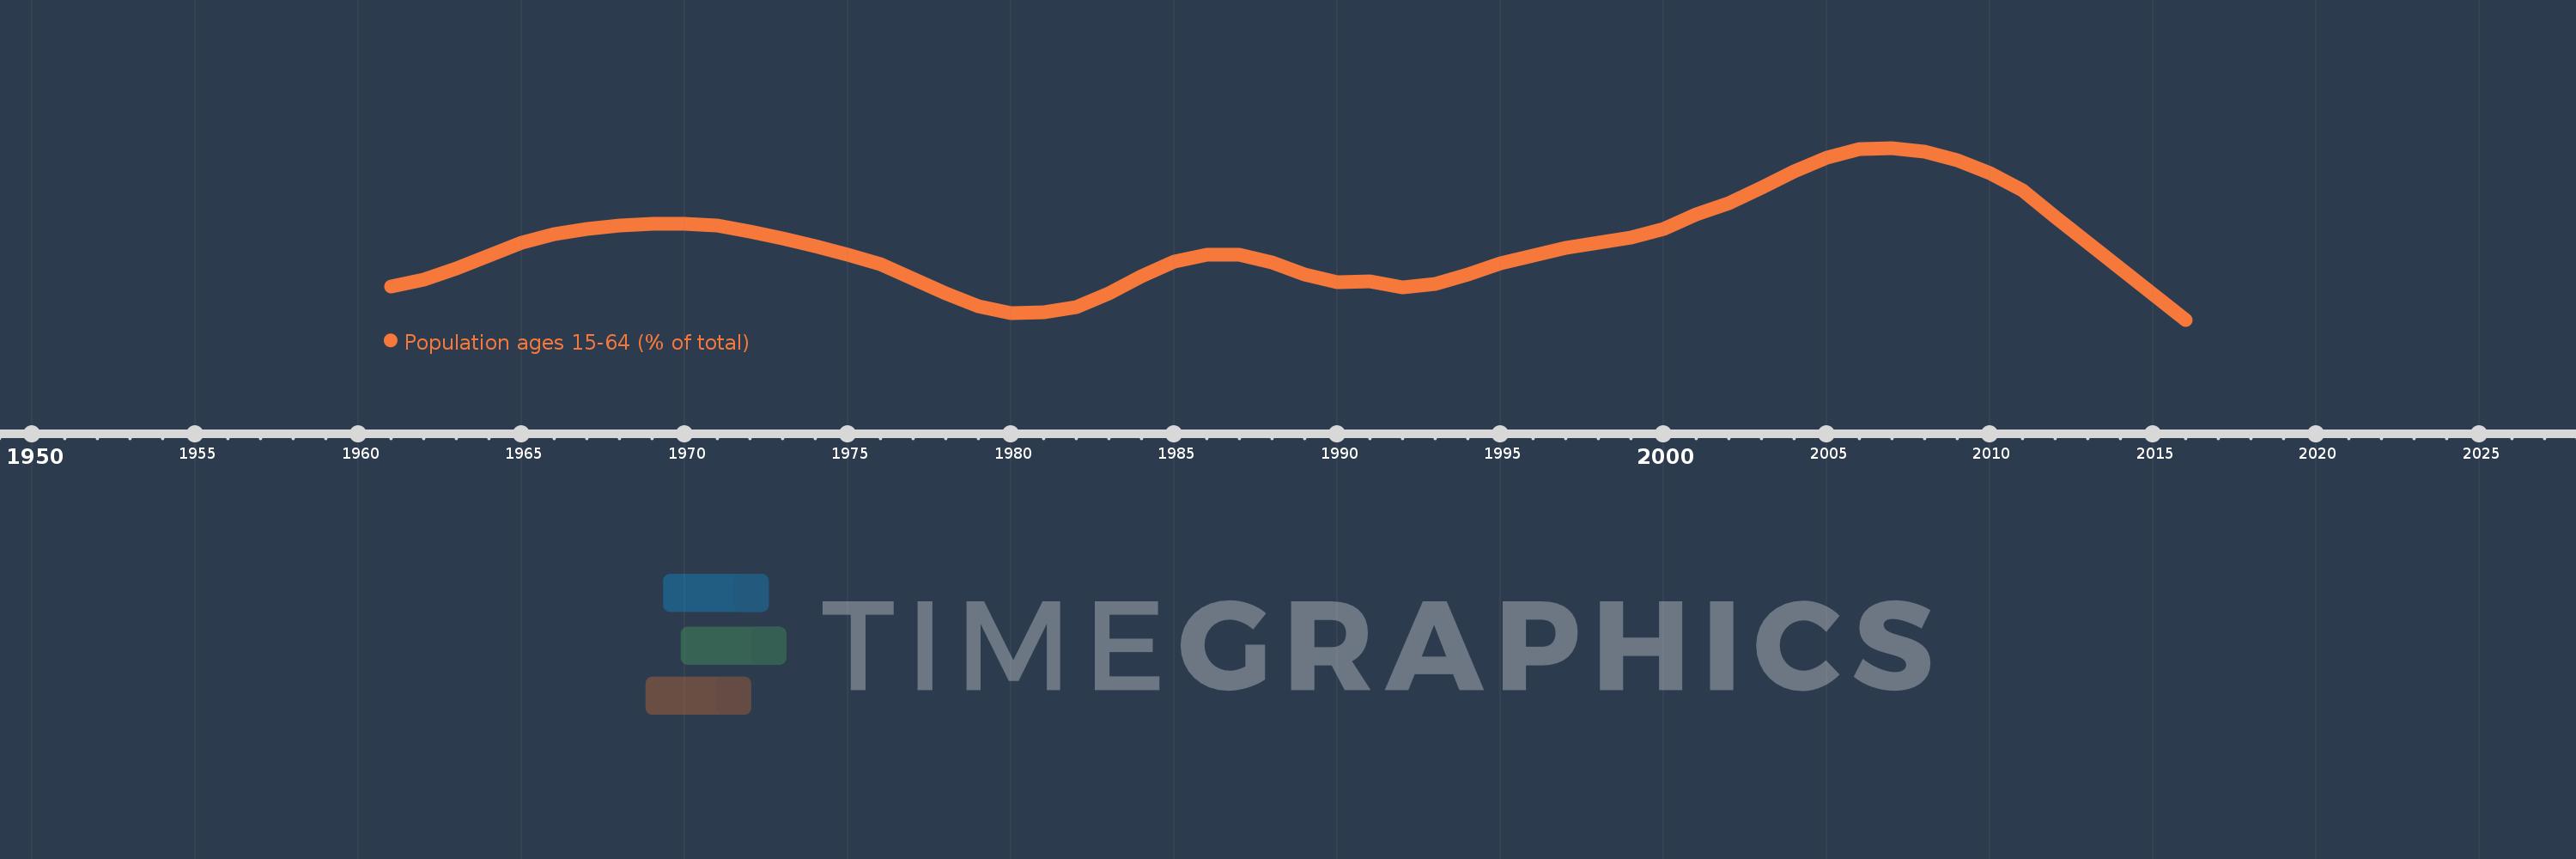
Population ages 15-64 (% of total)
2016,2015,2014,2013,2012,2011,2010,2009,2008,2007,2006,2005,2004,2003,2002,2001,2000,1999,1998,1997,1996,1995,1994,1993,1992,1991,1990,1989,1988,1987,1986,1985,1984,1983,1982,1981,1980,1979,1978,1977,1976,1975,1974,1973,1972,1971,1970,1969,1968,1967,1966,1965,1964,1963,1962,1961
This statistics in other country:
AfghanistanAlbaniaAlgeriaAngolaAntigua and BarbudaArab WorldArgentinaArmeniaArubaAustraliaAustriaAzerbaijanBahamas, TheBahrainBangladeshBarbadosBelarusBelgiumBelizeBeninBhutanBoliviaBosnia and HerzegovinaBotswanaBrazilBrunei DarussalamBulgariaBurkina FasoBurundiCabo VerdeCambodiaCameroonCanadaCaribbean small statesCentral African RepublicCentral Europe and the BalticsChadChannel IslandsChileChinaColombiaComorosCongo, Dem. Rep.Congo, Rep.Costa RicaCote d'IvoireCroatiaCubaCuracaoCyprusCzech RepublicDenmarkDjiboutiDominican RepublicEarly-demographic dividendEast Asia & PacificEast Asia & Pacific (excluding high income)East Asia & Pacific (IDA & IBRD countries)EcuadorEgypt, Arab Rep.El SalvadorEquatorial GuineaEritreaEstoniaEthiopiaEuro areaEurope & Central AsiaEurope & Central Asia (excluding high income)Europe & Central Asia (IDA & IBRD countries)European UnionFijiFinlandFragile and conflict affected situationsFranceFrench PolynesiaGabonGambia, TheGeorgiaGermanyGhanaGreeceGrenadaGuamGuatemalaGuineaGuinea-BissauGuyanaHaitiHeavily indebted poor countries (HIPC)High incomeHondurasHong Kong SAR, ChinaHungaryIBRD onlyIcelandIDA & IBRD totalIDA blendIDA onlyIDA totalIndiaIndonesiaIran, Islamic Rep.IraqIrelandIsraelItalyJamaicaJapanJordanKazakhstanKenyaKiribatiKorea, Dem. People’s Rep.Korea, Rep.KosovoKuwaitKyrgyz RepublicLao PDRLate-demographic dividendLatin America & Caribbean Latin America & Caribbean (excluding high income)Latin America & the Caribbean (IDA & IBRD countries)LatviaLeast developed countries: UN classificationLebanonLesothoLiberiaLibyaLithuaniaLow & middle incomeLow incomeLower middle incomeLuxembourgMacao SAR, ChinaMacedonia, FYRMadagascarMalawiMalaysiaMaldivesMaliMaltaMauritaniaMauritiusMexicoMicronesia, Fed. Sts.Middle East & North AfricaMiddle East & North Africa (excluding high income)Middle East & North Africa (IDA & IBRD countries)Middle incomeMoldovaMongoliaMontenegroMoroccoMozambiqueMyanmarNamibiaNepalNetherlandsNew CaledoniaNew ZealandNicaraguaNigerNigeriaNorth AmericaNorwayOECD membersOmanOther small statesPacific island small statesPakistanPanamaPapua New GuineaParaguayPeruPhilippinesPolandPortugalPost-demographic dividendPre-demographic dividendPuerto RicoQatarRomaniaRussian FederationRwandaSamoaSao Tome and PrincipeSaudi ArabiaSenegalSerbiaSeychellesSierra LeoneSingaporeSlovak RepublicSloveniaSmall statesSolomon IslandsSomaliaSouth AfricaSouth AsiaSouth Asia (IDA & IBRD)South SudanSpainSri LankaSt. LuciaSt. Vincent and the GrenadinesSub-Saharan Africa Sub-Saharan Africa (excluding high income)Sub-Saharan Africa (IDA & IBRD countries)SudanSurinameSwazilandSwedenSwitzerlandSyrian Arab RepublicTajikistanTanzaniaThailandTimor-LesteTogoTongaTrinidad and TobagoTunisiaTurkeyTurkmenistanUgandaUkraineUnited Arab EmiratesUnited KingdomUnited StatesUpper middle incomeUruguayUzbekistanVanuatuVenezuela, RBVietnamVirgin Islands (U.S.)West Bank and GazaWorldYemen, Rep.ZambiaZimbabwe Timeline:
This timeline shows a graph from 1961 to 2016 of Bulgaria. No data until 1960. Number of actual observations by date: 56.
Source name:
World Development Indicators
Source organization:
World Bank staff estimates based on age distributions of United Nations Population Division's World Population Prospects.
Categories, topics:
Education, Health
Last updated:
apr 23, 2017
Indicators value changes by year
Minimum:
65.829
jan 1, 2016
Maximum:
68.955
jan 1, 2007
At the date of observation
Value
Absolute change
Change from previous value
jan 1, 1961
66.439
+66.439
0.0%
jan 1, 1962
66.557
+0.118
0.18%
jan 1, 1963
66.757
+0.2
0.3%
jan 1, 1964
67.002
+0.245
0.37%
jan 1, 1965
67.226
+0.224
0.33%
jan 1, 1966
67.395
+0.169
0.25%
jan 1, 1967
67.487
+0.092
0.14%
jan 1, 1968
67.549
+0.061
0.09%
jan 1, 1969
67.576
+0.027
0.04%
jan 1, 1970
67.573
-0.003
0.0%
jan 1, 1971
67.538
-0.035
-0.05%
jan 1, 1972
67.431
-0.107
-0.16%
jan 1, 1973
67.312
-0.119
-0.18%
jan 1, 1974
67.175
-0.137
-0.2%
jan 1, 1975
67.015
-0.16
-0.24%
jan 1, 1976
66.835
-0.18
-0.27%
jan 1, 1977
66.57
-0.265
-0.4%
jan 1, 1978
66.302
-0.268
-0.4%
jan 1, 1979
66.073
-0.228
-0.34%
jan 1, 1980
65.953
-0.12
-0.18%
jan 1, 1981
65.972
+0.019
0.03%
jan 1, 1982
66.058
+0.086
0.13%
jan 1, 1983
66.307
+0.249
0.38%
jan 1, 1984
66.629
+0.322
0.49%
jan 1, 1985
66.889
+0.26
0.39%
jan 1, 1986
67.013
+0.124
0.19%
jan 1, 1987
67.02
+0.007
0.01%
jan 1, 1988
66.87
-0.15
-0.22%
jan 1, 1989
66.657
-0.213
-0.32%
jan 1, 1990
66.517
-0.14
-0.21%
jan 1, 1991
66.521
+0.004
0.01%
jan 1, 1992
66.411
-0.11
-0.17%
jan 1, 1993
66.475
+0.064
0.1%
jan 1, 1994
66.657
+0.181
0.27%
jan 1, 1995
66.849
+0.193
0.29%
jan 1, 1996
66.995
+0.145
0.22%
jan 1, 1997
67.138
+0.144
0.21%
jan 1, 1998
67.23
+0.092
0.14%
jan 1, 1999
67.317
+0.086
0.13%
jan 1, 2000
67.477
+0.16
0.24%
jan 1, 2001
67.745
+0.268
0.4%
jan 1, 2002
67.949
+0.204
0.3%
jan 1, 2003
68.227
+0.279
0.41%
jan 1, 2004
68.527
+0.3
0.44%
jan 1, 2005
68.775
+0.248
0.36%
jan 1, 2006
68.928
+0.152
0.22%
jan 1, 2007
68.955
+0.027
0.04%
jan 1, 2008
68.892
-0.062
-0.09%
jan 1, 2009
68.733
-0.159
-0.23%
jan 1, 2010
68.49
-0.243
-0.35%
jan 1, 2011
68.178
-0.313
-0.46%
jan 1, 2012
67.702
-0.476
-0.7%
jan 1, 2013
67.232
-0.47
-0.69%
jan 1, 2014
66.765
-0.467
-0.7%
jan 1, 2015
66.292
-0.473
-0.71%
jan 1, 2016
65.829
-0.464
-0.7%
Ranking of countries by current statistics by years


Comments: