29
/
en
AIzaSyAYiBZKx7MnpbEhh9jyipgxe19OcubqV5w
April 1, 2024
151938
Hong Kong SAR, China
HKG
true
2
1
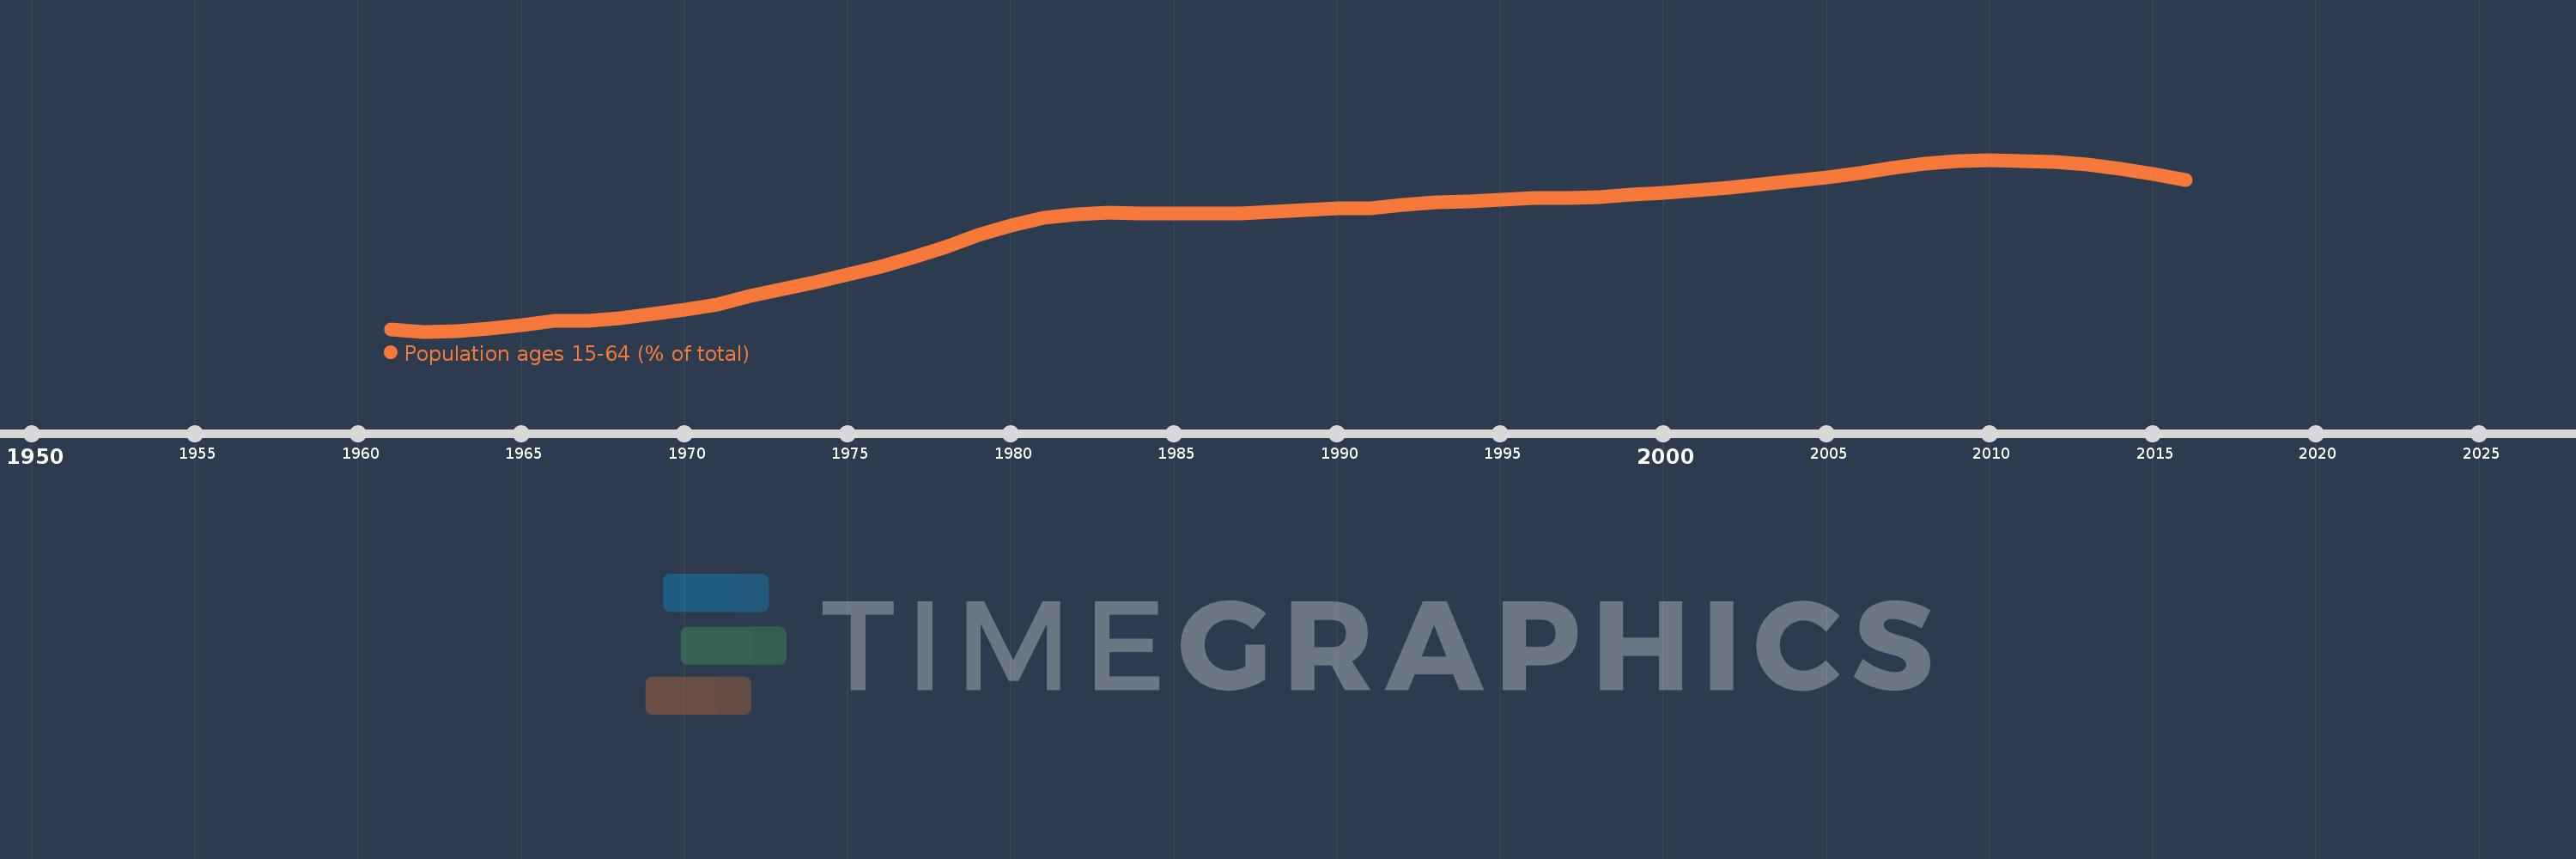
Population ages 15-64 (% of total)
2016,2015,2014,2013,2012,2011,2010,2009,2008,2007,2006,2005,2004,2003,2002,2001,2000,1999,1998,1997,1996,1995,1994,1993,1992,1991,1990,1989,1988,1987,1986,1985,1984,1983,1982,1981,1980,1979,1978,1977,1976,1975,1974,1973,1972,1971,1970,1969,1968,1967,1966,1965,1964,1963,1962,1961
This statistics in other country:
AfghanistanAlbaniaAlgeriaAngolaAntigua and BarbudaArab WorldArgentinaArmeniaArubaAustraliaAustriaAzerbaijanBahamas, TheBahrainBangladeshBarbadosBelarusBelgiumBelizeBeninBhutanBoliviaBosnia and HerzegovinaBotswanaBrazilBrunei DarussalamBulgariaBurkina FasoBurundiCabo VerdeCambodiaCameroonCanadaCaribbean small statesCentral African RepublicCentral Europe and the BalticsChadChannel IslandsChileChinaColombiaComorosCongo, Dem. Rep.Congo, Rep.Costa RicaCote d'IvoireCroatiaCubaCuracaoCyprusCzech RepublicDenmarkDjiboutiDominican RepublicEarly-demographic dividendEast Asia & PacificEast Asia & Pacific (excluding high income)East Asia & Pacific (IDA & IBRD countries)EcuadorEgypt, Arab Rep.El SalvadorEquatorial GuineaEritreaEstoniaEthiopiaEuro areaEurope & Central AsiaEurope & Central Asia (excluding high income)Europe & Central Asia (IDA & IBRD countries)European UnionFijiFinlandFragile and conflict affected situationsFranceFrench PolynesiaGabonGambia, TheGeorgiaGermanyGhanaGreeceGrenadaGuamGuatemalaGuineaGuinea-BissauGuyanaHaitiHeavily indebted poor countries (HIPC)High incomeHondurasHong Kong SAR, ChinaHungaryIBRD onlyIcelandIDA & IBRD totalIDA blendIDA onlyIDA totalIndiaIndonesiaIran, Islamic Rep.IraqIrelandIsraelItalyJamaicaJapanJordanKazakhstanKenyaKiribatiKorea, Dem. People’s Rep.Korea, Rep.KosovoKuwaitKyrgyz RepublicLao PDRLate-demographic dividendLatin America & Caribbean Latin America & Caribbean (excluding high income)Latin America & the Caribbean (IDA & IBRD countries)LatviaLeast developed countries: UN classificationLebanonLesothoLiberiaLibyaLithuaniaLow & middle incomeLow incomeLower middle incomeLuxembourgMacao SAR, ChinaMacedonia, FYRMadagascarMalawiMalaysiaMaldivesMaliMaltaMauritaniaMauritiusMexicoMicronesia, Fed. Sts.Middle East & North AfricaMiddle East & North Africa (excluding high income)Middle East & North Africa (IDA & IBRD countries)Middle incomeMoldovaMongoliaMontenegroMoroccoMozambiqueMyanmarNamibiaNepalNetherlandsNew CaledoniaNew ZealandNicaraguaNigerNigeriaNorth AmericaNorwayOECD membersOmanOther small statesPacific island small statesPakistanPanamaPapua New GuineaParaguayPeruPhilippinesPolandPortugalPost-demographic dividendPre-demographic dividendPuerto RicoQatarRomaniaRussian FederationRwandaSamoaSao Tome and PrincipeSaudi ArabiaSenegalSerbiaSeychellesSierra LeoneSingaporeSlovak RepublicSloveniaSmall statesSolomon IslandsSomaliaSouth AfricaSouth AsiaSouth Asia (IDA & IBRD)South SudanSpainSri LankaSt. LuciaSt. Vincent and the GrenadinesSub-Saharan Africa Sub-Saharan Africa (excluding high income)Sub-Saharan Africa (IDA & IBRD countries)SudanSurinameSwazilandSwedenSwitzerlandSyrian Arab RepublicTajikistanTanzaniaThailandTimor-LesteTogoTongaTrinidad and TobagoTunisiaTurkeyTurkmenistanUgandaUkraineUnited Arab EmiratesUnited KingdomUnited StatesUpper middle incomeUruguayUzbekistanVanuatuVenezuela, RBVietnamVirgin Islands (U.S.)West Bank and GazaWorldYemen, Rep.ZambiaZimbabwe Timeline:
This timeline shows a graph from 1961 to 2016 of Hong Kong SAR, China. No data until 1960. Number of actual observations by date: 56.
Source name:
World Development Indicators
Source organization:
World Bank staff estimates based on age distributions of United Nations Population Division's World Population Prospects.
Categories, topics:
Education, Health
Last updated:
apr 23, 2017
Indicators value changes by year
Minimum:
56.033
jan 1, 1962
Maximum:
75.183
jan 1, 2010
At the date of observation
Value
Absolute change
Change from previous value
jan 1, 1961
56.292
+56.292
0.0%
jan 1, 1962
56.033
-0.259
-0.46%
jan 1, 1963
56.104
+0.071
0.13%
jan 1, 1964
56.381
+0.277
0.49%
jan 1, 1965
56.752
+0.371
0.66%
jan 1, 1966
57.219
+0.467
0.82%
jan 1, 1967
57.265
+0.046
0.08%
jan 1, 1968
57.546
+0.282
0.49%
jan 1, 1969
57.983
+0.437
0.76%
jan 1, 1970
58.486
+0.502
0.87%
jan 1, 1971
59.011
+0.525
0.9%
jan 1, 1972
59.964
+0.954
1.62%
jan 1, 1973
60.803
+0.838
1.4%
jan 1, 1974
61.582
+0.779
1.28%
jan 1, 1975
62.405
+0.823
1.34%
jan 1, 1976
63.302
+0.897
1.44%
jan 1, 1977
64.3
+0.998
1.58%
jan 1, 1978
65.51
+1.21
1.88%
jan 1, 1979
66.76
+1.25
1.91%
jan 1, 1980
67.857
+1.097
1.64%
jan 1, 1981
68.728
+0.871
1.28%
jan 1, 1982
69.146
+0.418
0.61%
jan 1, 1983
69.28
+0.135
0.19%
jan 1, 1984
69.237
-0.044
-0.06%
jan 1, 1985
69.177
-0.059
-0.09%
jan 1, 1986
69.186
+0.009
0.01%
jan 1, 1987
69.231
+0.044
0.06%
jan 1, 1988
69.395
+0.165
0.24%
jan 1, 1989
69.602
+0.207
0.3%
jan 1, 1990
69.752
+0.15
0.22%
jan 1, 1991
69.817
+0.065
0.09%
jan 1, 1992
70.19
+0.374
0.54%
jan 1, 1993
70.416
+0.225
0.32%
jan 1, 1994
70.555
+0.139
0.2%
jan 1, 1995
70.715
+0.16
0.23%
jan 1, 1996
70.947
+0.232
0.33%
jan 1, 1997
70.925
-0.022
-0.03%
jan 1, 1998
71.053
+0.128
0.18%
jan 1, 1999
71.275
+0.221
0.31%
jan 1, 2000
71.522
+0.247
0.35%
jan 1, 2001
71.789
+0.267
0.37%
jan 1, 2002
72.116
+0.327
0.46%
jan 1, 2003
72.453
+0.337
0.47%
jan 1, 2004
72.811
+0.358
0.49%
jan 1, 2005
73.22
+0.409
0.56%
jan 1, 2006
73.685
+0.466
0.64%
jan 1, 2007
74.238
+0.553
0.75%
jan 1, 2008
74.74
+0.502
0.68%
jan 1, 2009
75.086
+0.346
0.46%
jan 1, 2010
75.183
+0.097
0.13%
jan 1, 2011
75.026
-0.157
-0.21%
jan 1, 2012
74.946
-0.08
-0.11%
jan 1, 2013
74.629
-0.317
-0.42%
jan 1, 2014
74.144
-0.485
-0.65%
jan 1, 2015
73.582
-0.562
-0.76%
jan 1, 2016
72.979
-0.604
-0.82%
Ranking of countries by current statistics by years


Comments: