29
/
en
AIzaSyAYiBZKx7MnpbEhh9jyipgxe19OcubqV5w
April 1, 2024
38493
IDA blend
IDB
false
2
1
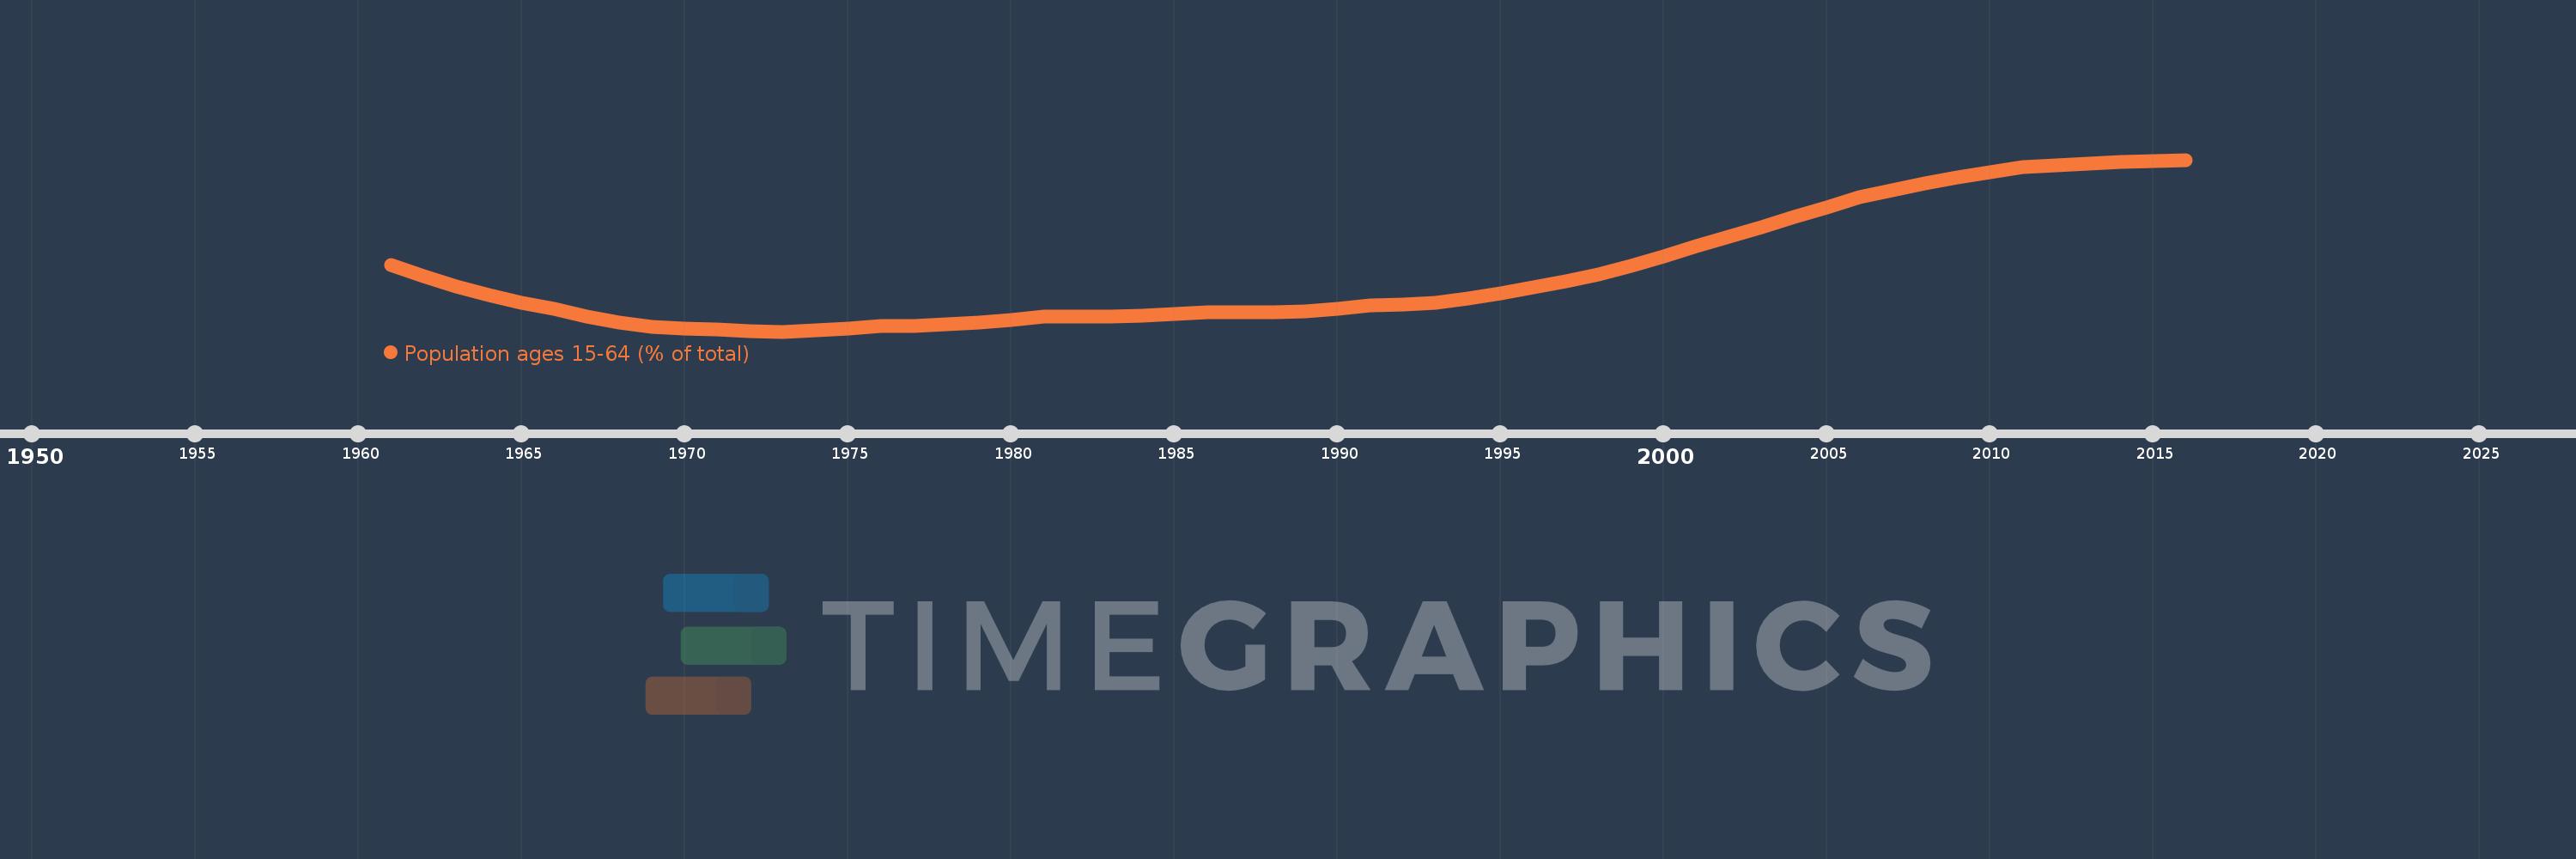
Population ages 15-64 (% of total)
2016,2015,2014,2013,2012,2011,2010,2009,2008,2007,2006,2005,2004,2003,2002,2001,2000,1999,1998,1997,1996,1995,1994,1993,1992,1991,1990,1989,1988,1987,1986,1985,1984,1983,1982,1981,1980,1979,1978,1977,1976,1975,1974,1973,1972,1971,1970,1969,1968,1967,1966,1965,1964,1963,1962,1961
This statistics in other country:
AfghanistanAlbaniaAlgeriaAngolaAntigua and BarbudaArab WorldArgentinaArmeniaArubaAustraliaAustriaAzerbaijanBahamas, TheBahrainBangladeshBarbadosBelarusBelgiumBelizeBeninBhutanBoliviaBosnia and HerzegovinaBotswanaBrazilBrunei DarussalamBulgariaBurkina FasoBurundiCabo VerdeCambodiaCameroonCanadaCaribbean small statesCentral African RepublicCentral Europe and the BalticsChadChannel IslandsChileChinaColombiaComorosCongo, Dem. Rep.Congo, Rep.Costa RicaCote d'IvoireCroatiaCubaCuracaoCyprusCzech RepublicDenmarkDjiboutiDominican RepublicEarly-demographic dividendEast Asia & PacificEast Asia & Pacific (excluding high income)East Asia & Pacific (IDA & IBRD countries)EcuadorEgypt, Arab Rep.El SalvadorEquatorial GuineaEritreaEstoniaEthiopiaEuro areaEurope & Central AsiaEurope & Central Asia (excluding high income)Europe & Central Asia (IDA & IBRD countries)European UnionFijiFinlandFragile and conflict affected situationsFranceFrench PolynesiaGabonGambia, TheGeorgiaGermanyGhanaGreeceGrenadaGuamGuatemalaGuineaGuinea-BissauGuyanaHaitiHeavily indebted poor countries (HIPC)High incomeHondurasHong Kong SAR, ChinaHungaryIBRD onlyIcelandIDA & IBRD totalIDA blendIDA onlyIDA totalIndiaIndonesiaIran, Islamic Rep.IraqIrelandIsraelItalyJamaicaJapanJordanKazakhstanKenyaKiribatiKorea, Dem. People’s Rep.Korea, Rep.KosovoKuwaitKyrgyz RepublicLao PDRLate-demographic dividendLatin America & Caribbean Latin America & Caribbean (excluding high income)Latin America & the Caribbean (IDA & IBRD countries)LatviaLeast developed countries: UN classificationLebanonLesothoLiberiaLibyaLithuaniaLow & middle incomeLow incomeLower middle incomeLuxembourgMacao SAR, ChinaMacedonia, FYRMadagascarMalawiMalaysiaMaldivesMaliMaltaMauritaniaMauritiusMexicoMicronesia, Fed. Sts.Middle East & North AfricaMiddle East & North Africa (excluding high income)Middle East & North Africa (IDA & IBRD countries)Middle incomeMoldovaMongoliaMontenegroMoroccoMozambiqueMyanmarNamibiaNepalNetherlandsNew CaledoniaNew ZealandNicaraguaNigerNigeriaNorth AmericaNorwayOECD membersOmanOther small statesPacific island small statesPakistanPanamaPapua New GuineaParaguayPeruPhilippinesPolandPortugalPost-demographic dividendPre-demographic dividendPuerto RicoQatarRomaniaRussian FederationRwandaSamoaSao Tome and PrincipeSaudi ArabiaSenegalSerbiaSeychellesSierra LeoneSingaporeSlovak RepublicSloveniaSmall statesSolomon IslandsSomaliaSouth AfricaSouth AsiaSouth Asia (IDA & IBRD)South SudanSpainSri LankaSt. LuciaSt. Vincent and the GrenadinesSub-Saharan Africa Sub-Saharan Africa (excluding high income)Sub-Saharan Africa (IDA & IBRD countries)SudanSurinameSwazilandSwedenSwitzerlandSyrian Arab RepublicTajikistanTanzaniaThailandTimor-LesteTogoTongaTrinidad and TobagoTunisiaTurkeyTurkmenistanUgandaUkraineUnited Arab EmiratesUnited KingdomUnited StatesUpper middle incomeUruguayUzbekistanVanuatuVenezuela, RBVietnamVirgin Islands (U.S.)West Bank and GazaWorldYemen, Rep.ZambiaZimbabwe Timeline:
This timeline shows a graph from 1961 to 2016 of IDA blend. No data until 1960. Number of actual observations by date: 56.
Source name:
World Development Indicators
Source organization:
World Bank staff estimates based on age distributions of United Nations Population Division's World Population Prospects.
Categories, topics:
Education, Health
Last updated:
apr 23, 2017
Indicators value changes by year
Minimum:
53.121
jan 1, 1973
Maximum:
59.982
jan 1, 2016
At the date of observation
Value
Absolute change
Change from previous value
jan 1, 1961
55.779
+55.779
0.0%
jan 1, 1962
55.321
-0.457
-0.82%
jan 1, 1963
54.928
-0.393
-0.71%
jan 1, 1964
54.583
-0.345
-0.63%
jan 1, 1965
54.278
-0.304
-0.56%
jan 1, 1966
54.023
-0.255
-0.47%
jan 1, 1967
53.72
-0.302
-0.56%
jan 1, 1968
53.487
-0.233
-0.43%
jan 1, 1969
53.326
-0.161
-0.3%
jan 1, 1970
53.238
-0.088
-0.17%
jan 1, 1971
53.217
-0.021
-0.04%
jan 1, 1972
53.136
-0.081
-0.15%
jan 1, 1973
53.121
-0.015
-0.03%
jan 1, 1974
53.161
+0.04
0.08%
jan 1, 1975
53.242
+0.081
0.15%
jan 1, 1976
53.355
+0.113
0.21%
jan 1, 1977
53.345
-0.01
-0.02%
jan 1, 1978
53.396
+0.051
0.1%
jan 1, 1979
53.488
+0.091
0.17%
jan 1, 1980
53.595
+0.108
0.2%
jan 1, 1981
53.705
+0.11
0.21%
jan 1, 1982
53.708
+0.003
0.0%
jan 1, 1983
53.731
+0.023
0.04%
jan 1, 1984
53.769
+0.038
0.07%
jan 1, 1985
53.827
+0.058
0.11%
jan 1, 1986
53.908
+0.08
0.15%
jan 1, 1987
53.876
-0.032
-0.06%
jan 1, 1988
53.889
+0.012
0.02%
jan 1, 1989
53.942
+0.054
0.1%
jan 1, 1990
54.037
+0.095
0.18%
jan 1, 1991
54.172
+0.135
0.25%
jan 1, 1992
54.194
+0.022
0.04%
jan 1, 1993
54.285
+0.091
0.17%
jan 1, 1994
54.435
+0.151
0.28%
jan 1, 1995
54.64
+0.204
0.38%
jan 1, 1996
54.896
+0.256
0.47%
jan 1, 1997
55.118
+0.223
0.41%
jan 1, 1998
55.401
+0.282
0.51%
jan 1, 1999
55.738
+0.337
0.61%
jan 1, 2000
56.121
+0.383
0.69%
jan 1, 2001
56.539
+0.418
0.74%
jan 1, 2002
56.902
+0.363
0.64%
jan 1, 2003
57.287
+0.385
0.68%
jan 1, 2004
57.688
+0.401
0.7%
jan 1, 2005
58.091
+0.403
0.7%
jan 1, 2006
58.48
+0.39
0.67%
jan 1, 2007
58.76
+0.28
0.48%
jan 1, 2008
59.025
+0.265
0.45%
jan 1, 2009
59.27
+0.245
0.41%
jan 1, 2010
59.491
+0.221
0.37%
jan 1, 2011
59.688
+0.197
0.33%
jan 1, 2012
59.754
+0.065
0.11%
jan 1, 2013
59.82
+0.067
0.11%
jan 1, 2014
59.882
+0.062
0.1%
jan 1, 2015
59.936
+0.053
0.09%
jan 1, 2016
59.982
+0.046
0.08%
Ranking of countries by current statistics by years


Comments: