29
/
en
AIzaSyAYiBZKx7MnpbEhh9jyipgxe19OcubqV5w
April 1, 2024
95334
Burkina Faso
BFA
true
2
1
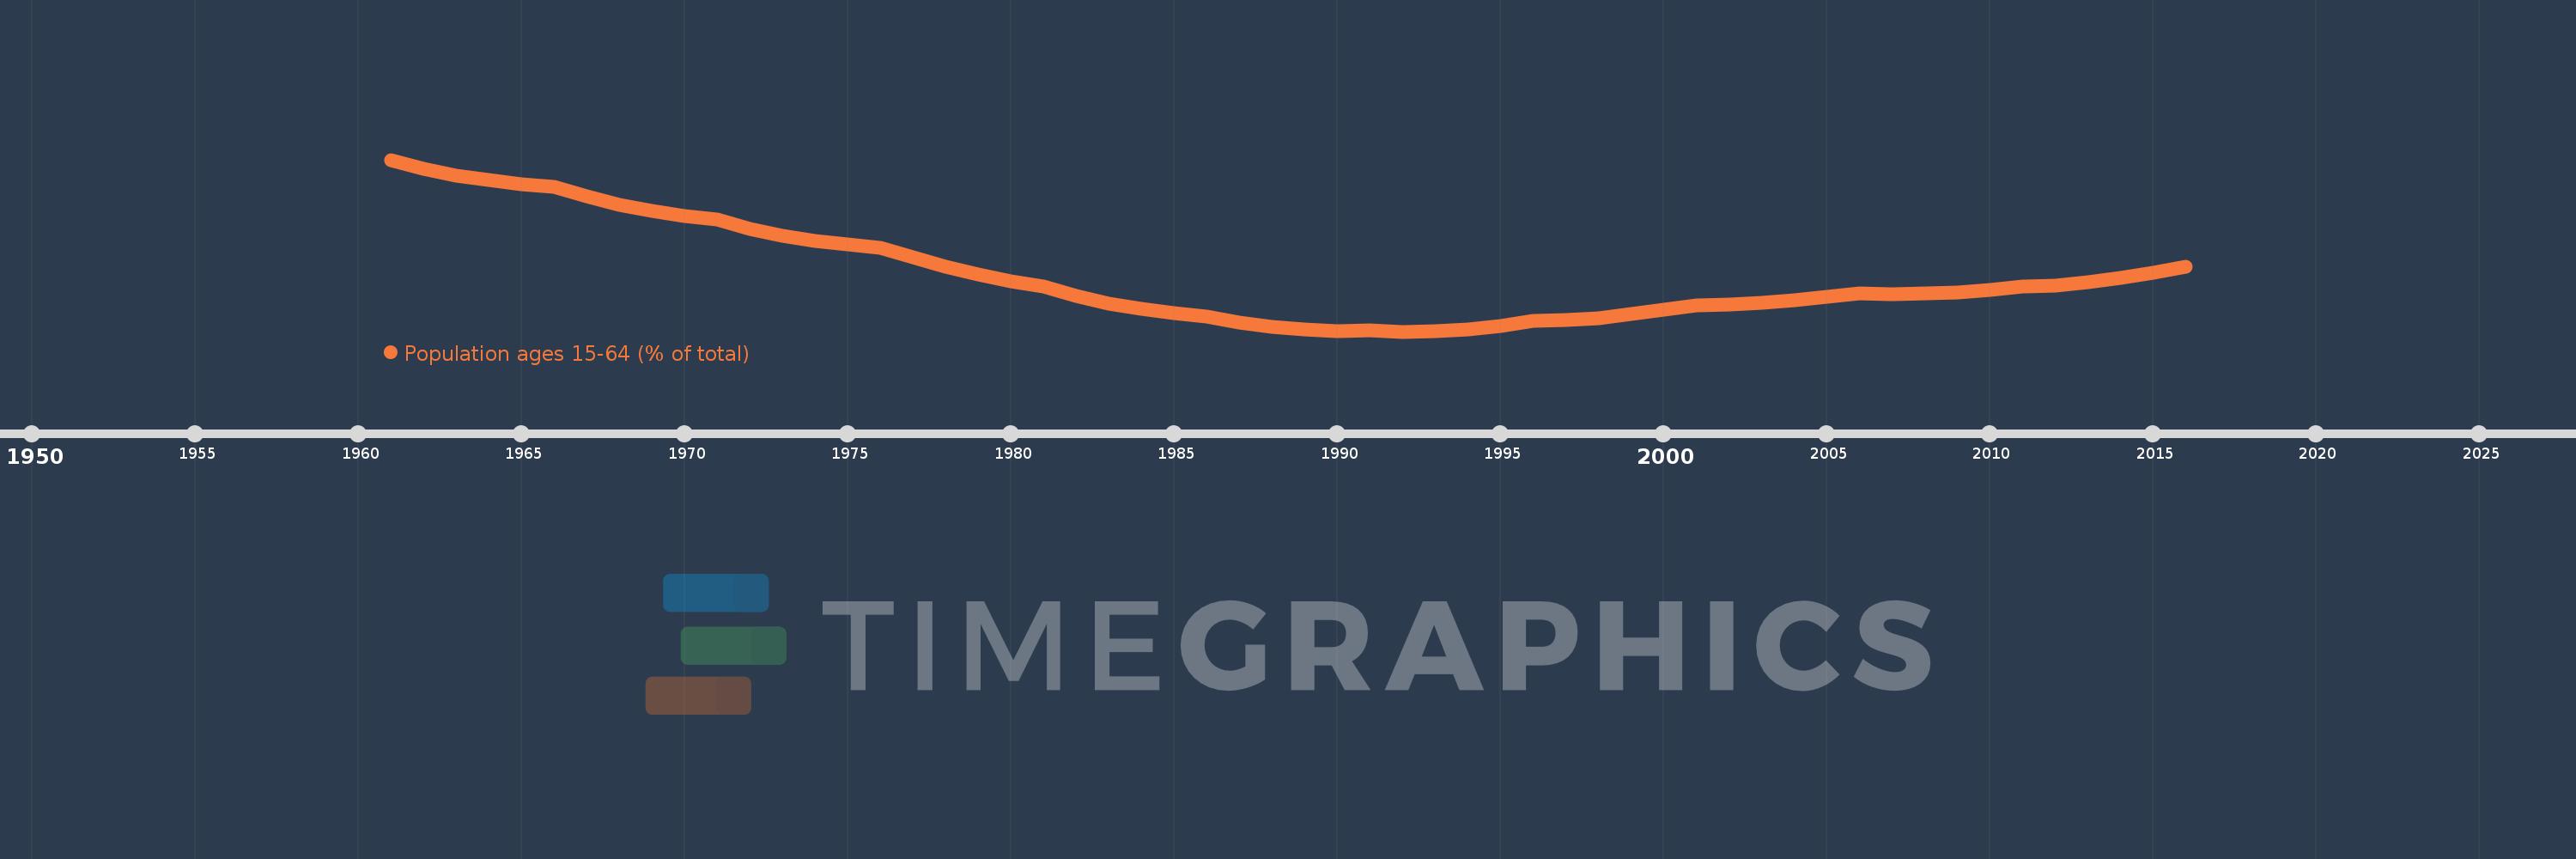
Population ages 15-64 (% of total)
2016,2015,2014,2013,2012,2011,2010,2009,2008,2007,2006,2005,2004,2003,2002,2001,2000,1999,1998,1997,1996,1995,1994,1993,1992,1991,1990,1989,1988,1987,1986,1985,1984,1983,1982,1981,1980,1979,1978,1977,1976,1975,1974,1973,1972,1971,1970,1969,1968,1967,1966,1965,1964,1963,1962,1961
This statistics in other country:
AfghanistanAlbaniaAlgeriaAngolaAntigua and BarbudaArab WorldArgentinaArmeniaArubaAustraliaAustriaAzerbaijanBahamas, TheBahrainBangladeshBarbadosBelarusBelgiumBelizeBeninBhutanBoliviaBosnia and HerzegovinaBotswanaBrazilBrunei DarussalamBulgariaBurkina FasoBurundiCabo VerdeCambodiaCameroonCanadaCaribbean small statesCentral African RepublicCentral Europe and the BalticsChadChannel IslandsChileChinaColombiaComorosCongo, Dem. Rep.Congo, Rep.Costa RicaCote d'IvoireCroatiaCubaCuracaoCyprusCzech RepublicDenmarkDjiboutiDominican RepublicEarly-demographic dividendEast Asia & PacificEast Asia & Pacific (excluding high income)East Asia & Pacific (IDA & IBRD countries)EcuadorEgypt, Arab Rep.El SalvadorEquatorial GuineaEritreaEstoniaEthiopiaEuro areaEurope & Central AsiaEurope & Central Asia (excluding high income)Europe & Central Asia (IDA & IBRD countries)European UnionFijiFinlandFragile and conflict affected situationsFranceFrench PolynesiaGabonGambia, TheGeorgiaGermanyGhanaGreeceGrenadaGuamGuatemalaGuineaGuinea-BissauGuyanaHaitiHeavily indebted poor countries (HIPC)High incomeHondurasHong Kong SAR, ChinaHungaryIBRD onlyIcelandIDA & IBRD totalIDA blendIDA onlyIDA totalIndiaIndonesiaIran, Islamic Rep.IraqIrelandIsraelItalyJamaicaJapanJordanKazakhstanKenyaKiribatiKorea, Dem. People’s Rep.Korea, Rep.KosovoKuwaitKyrgyz RepublicLao PDRLate-demographic dividendLatin America & Caribbean Latin America & Caribbean (excluding high income)Latin America & the Caribbean (IDA & IBRD countries)LatviaLeast developed countries: UN classificationLebanonLesothoLiberiaLibyaLithuaniaLow & middle incomeLow incomeLower middle incomeLuxembourgMacao SAR, ChinaMacedonia, FYRMadagascarMalawiMalaysiaMaldivesMaliMaltaMauritaniaMauritiusMexicoMicronesia, Fed. Sts.Middle East & North AfricaMiddle East & North Africa (excluding high income)Middle East & North Africa (IDA & IBRD countries)Middle incomeMoldovaMongoliaMontenegroMoroccoMozambiqueMyanmarNamibiaNepalNetherlandsNew CaledoniaNew ZealandNicaraguaNigerNigeriaNorth AmericaNorwayOECD membersOmanOther small statesPacific island small statesPakistanPanamaPapua New GuineaParaguayPeruPhilippinesPolandPortugalPost-demographic dividendPre-demographic dividendPuerto RicoQatarRomaniaRussian FederationRwandaSamoaSao Tome and PrincipeSaudi ArabiaSenegalSerbiaSeychellesSierra LeoneSingaporeSlovak RepublicSloveniaSmall statesSolomon IslandsSomaliaSouth AfricaSouth AsiaSouth Asia (IDA & IBRD)South SudanSpainSri LankaSt. LuciaSt. Vincent and the GrenadinesSub-Saharan Africa Sub-Saharan Africa (excluding high income)Sub-Saharan Africa (IDA & IBRD countries)SudanSurinameSwazilandSwedenSwitzerlandSyrian Arab RepublicTajikistanTanzaniaThailandTimor-LesteTogoTongaTrinidad and TobagoTunisiaTurkeyTurkmenistanUgandaUkraineUnited Arab EmiratesUnited KingdomUnited StatesUpper middle incomeUruguayUzbekistanVanuatuVenezuela, RBVietnamVirgin Islands (U.S.)West Bank and GazaWorldYemen, Rep.ZambiaZimbabwe Timeline:
This timeline shows a graph from 1961 to 2016 of Burkina Faso. No data until 1960. Number of actual observations by date: 56.
Source name:
World Development Indicators
Source organization:
World Bank staff estimates based on age distributions of United Nations Population Division's World Population Prospects.
Categories, topics:
Education, Health
Last updated:
apr 23, 2017
Indicators value changes by year
Minimum:
49.405
jan 1, 1992
Maximum:
56.349
jan 1, 1961
At the date of observation
Value
Absolute change
Change from previous value
jan 1, 1961
56.349
+56.349
0.0%
jan 1, 1962
55.983
-0.366
-0.65%
jan 1, 1963
55.718
-0.265
-0.47%
jan 1, 1964
55.527
-0.192
-0.34%
jan 1, 1965
55.376
-0.151
-0.27%
jan 1, 1966
55.248
-0.128
-0.23%
jan 1, 1967
54.869
-0.379
-0.69%
jan 1, 1968
54.542
-0.327
-0.6%
jan 1, 1969
54.268
-0.273
-0.5%
jan 1, 1970
54.064
-0.204
-0.38%
jan 1, 1971
53.934
-0.13
-0.24%
jan 1, 1972
53.537
-0.397
-0.74%
jan 1, 1973
53.261
-0.275
-0.51%
jan 1, 1974
53.073
-0.188
-0.35%
jan 1, 1975
52.924
-0.149
-0.28%
jan 1, 1976
52.788
-0.136
-0.26%
jan 1, 1977
52.391
-0.397
-0.75%
jan 1, 1978
52.026
-0.365
-0.7%
jan 1, 1979
51.702
-0.323
-0.62%
jan 1, 1980
51.44
-0.262
-0.51%
jan 1, 1981
51.242
-0.198
-0.38%
jan 1, 1982
50.83
-0.412
-0.8%
jan 1, 1983
50.534
-0.296
-0.58%
jan 1, 1984
50.32
-0.215
-0.42%
jan 1, 1985
50.151
-0.169
-0.34%
jan 1, 1986
50.016
-0.134
-0.27%
jan 1, 1987
49.763
-0.253
-0.51%
jan 1, 1988
49.585
-0.178
-0.36%
jan 1, 1989
49.476
-0.109
-0.22%
jan 1, 1990
49.436
-0.04
-0.08%
jan 1, 1991
49.464
+0.028
0.06%
jan 1, 1992
49.405
-0.059
-0.12%
jan 1, 1993
49.421
+0.016
0.03%
jan 1, 1994
49.504
+0.083
0.17%
jan 1, 1995
49.645
+0.141
0.28%
jan 1, 1996
49.834
+0.189
0.38%
jan 1, 1997
49.859
+0.025
0.05%
jan 1, 1998
49.957
+0.098
0.2%
jan 1, 1999
50.104
+0.147
0.3%
jan 1, 2000
50.278
+0.173
0.35%
jan 1, 2001
50.465
+0.188
0.37%
jan 1, 2002
50.487
+0.021
0.04%
jan 1, 2003
50.557
+0.07
0.14%
jan 1, 2004
50.664
+0.107
0.21%
jan 1, 2005
50.795
+0.131
0.26%
jan 1, 2006
50.938
+0.143
0.28%
jan 1, 2007
50.924
-0.014
-0.03%
jan 1, 2008
50.948
+0.023
0.05%
jan 1, 2009
51.002
+0.054
0.11%
jan 1, 2010
51.091
+0.089
0.17%
jan 1, 2011
51.221
+0.13
0.25%
jan 1, 2012
51.277
+0.056
0.11%
jan 1, 2013
51.402
+0.125
0.24%
jan 1, 2014
51.581
+0.179
0.35%
jan 1, 2015
51.795
+0.214
0.42%
jan 1, 2016
52.035
+0.239
0.46%
Ranking of countries by current statistics by years


Comments: