29
/
en
AIzaSyAYiBZKx7MnpbEhh9jyipgxe19OcubqV5w
April 1, 2024
182459
Luxembourg
LUX
true
2
1
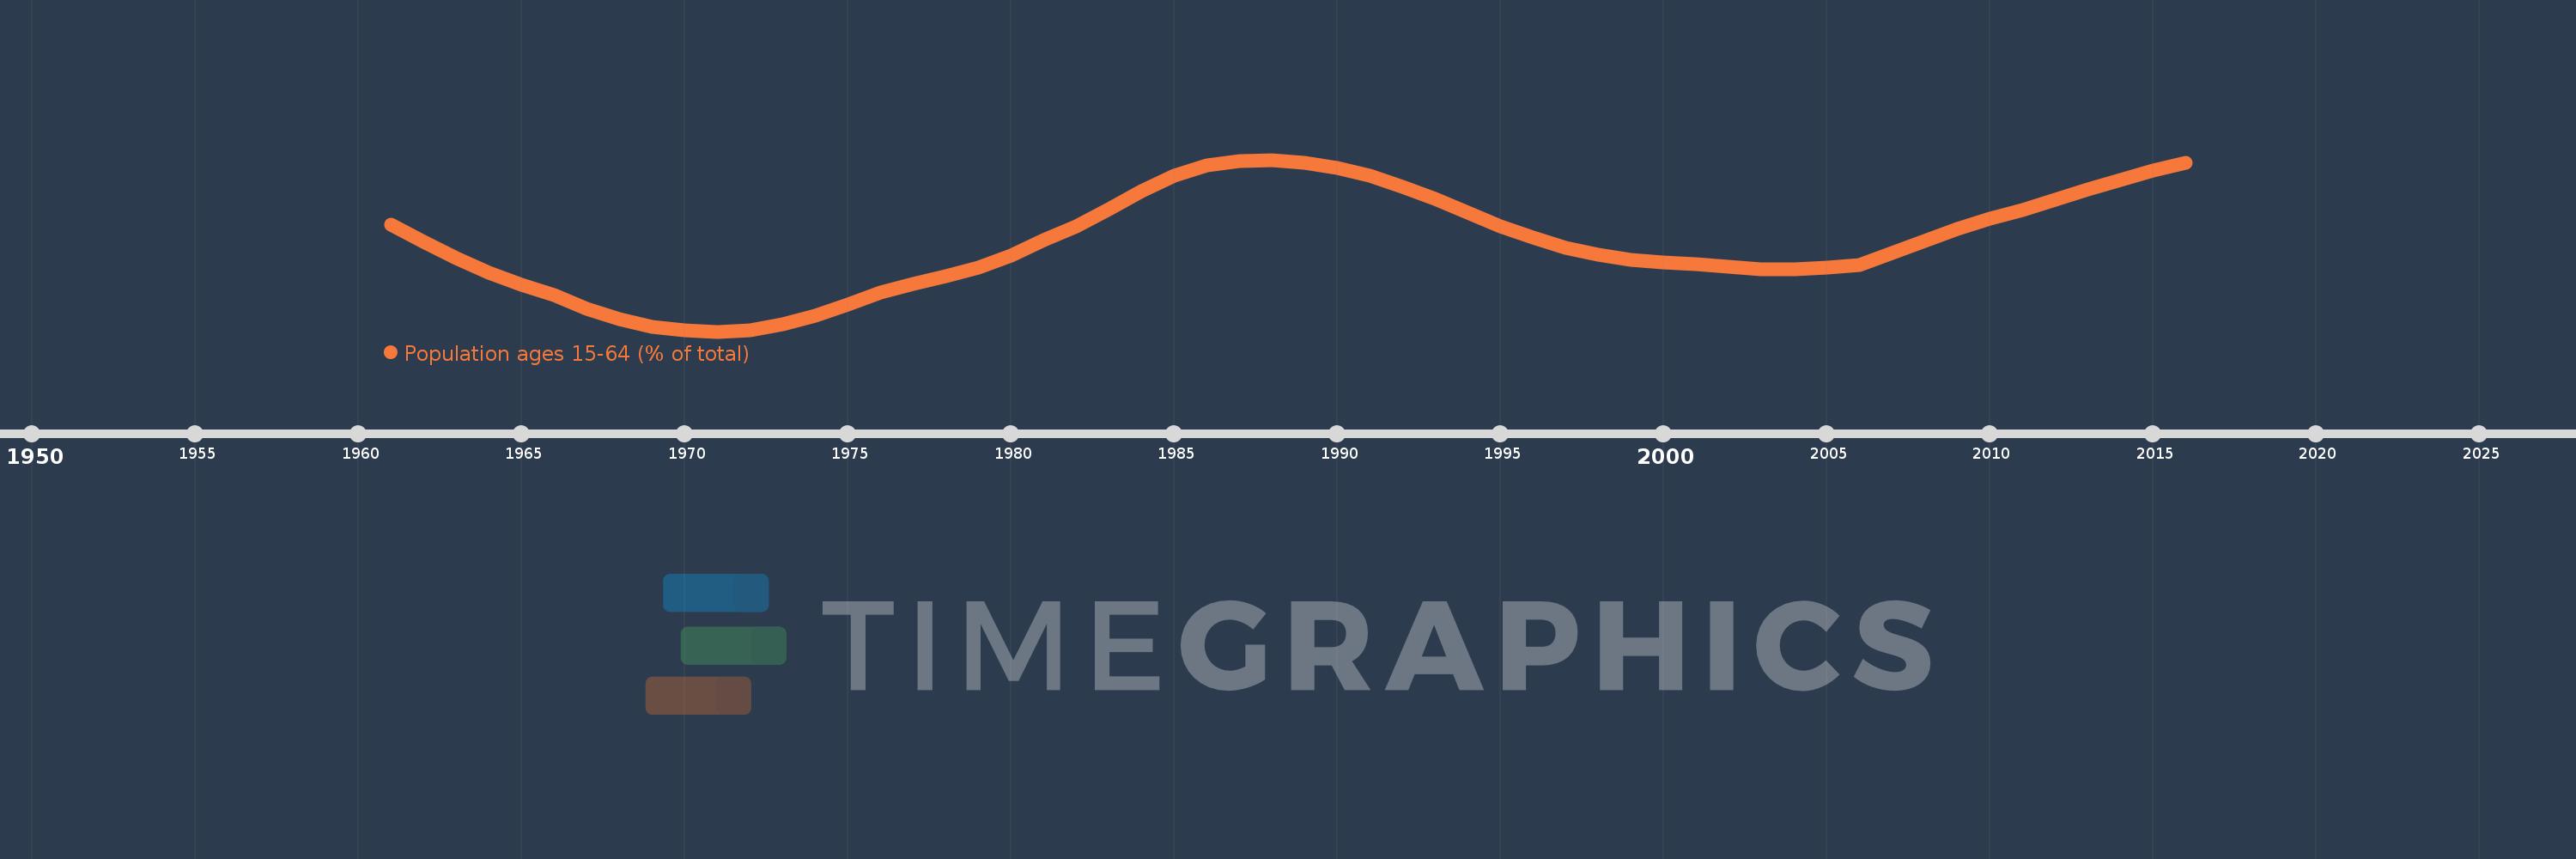
Population ages 15-64 (% of total)
2016,2015,2014,2013,2012,2011,2010,2009,2008,2007,2006,2005,2004,2003,2002,2001,2000,1999,1998,1997,1996,1995,1994,1993,1992,1991,1990,1989,1988,1987,1986,1985,1984,1983,1982,1981,1980,1979,1978,1977,1976,1975,1974,1973,1972,1971,1970,1969,1968,1967,1966,1965,1964,1963,1962,1961
This statistics in other country:
AfghanistanAlbaniaAlgeriaAngolaAntigua and BarbudaArab WorldArgentinaArmeniaArubaAustraliaAustriaAzerbaijanBahamas, TheBahrainBangladeshBarbadosBelarusBelgiumBelizeBeninBhutanBoliviaBosnia and HerzegovinaBotswanaBrazilBrunei DarussalamBulgariaBurkina FasoBurundiCabo VerdeCambodiaCameroonCanadaCaribbean small statesCentral African RepublicCentral Europe and the BalticsChadChannel IslandsChileChinaColombiaComorosCongo, Dem. Rep.Congo, Rep.Costa RicaCote d'IvoireCroatiaCubaCuracaoCyprusCzech RepublicDenmarkDjiboutiDominican RepublicEarly-demographic dividendEast Asia & PacificEast Asia & Pacific (excluding high income)East Asia & Pacific (IDA & IBRD countries)EcuadorEgypt, Arab Rep.El SalvadorEquatorial GuineaEritreaEstoniaEthiopiaEuro areaEurope & Central AsiaEurope & Central Asia (excluding high income)Europe & Central Asia (IDA & IBRD countries)European UnionFijiFinlandFragile and conflict affected situationsFranceFrench PolynesiaGabonGambia, TheGeorgiaGermanyGhanaGreeceGrenadaGuamGuatemalaGuineaGuinea-BissauGuyanaHaitiHeavily indebted poor countries (HIPC)High incomeHondurasHong Kong SAR, ChinaHungaryIBRD onlyIcelandIDA & IBRD totalIDA blendIDA onlyIDA totalIndiaIndonesiaIran, Islamic Rep.IraqIrelandIsraelItalyJamaicaJapanJordanKazakhstanKenyaKiribatiKorea, Dem. People’s Rep.Korea, Rep.KosovoKuwaitKyrgyz RepublicLao PDRLate-demographic dividendLatin America & Caribbean Latin America & Caribbean (excluding high income)Latin America & the Caribbean (IDA & IBRD countries)LatviaLeast developed countries: UN classificationLebanonLesothoLiberiaLibyaLithuaniaLow & middle incomeLow incomeLower middle incomeLuxembourgMacao SAR, ChinaMacedonia, FYRMadagascarMalawiMalaysiaMaldivesMaliMaltaMauritaniaMauritiusMexicoMicronesia, Fed. Sts.Middle East & North AfricaMiddle East & North Africa (excluding high income)Middle East & North Africa (IDA & IBRD countries)Middle incomeMoldovaMongoliaMontenegroMoroccoMozambiqueMyanmarNamibiaNepalNetherlandsNew CaledoniaNew ZealandNicaraguaNigerNigeriaNorth AmericaNorwayOECD membersOmanOther small statesPacific island small statesPakistanPanamaPapua New GuineaParaguayPeruPhilippinesPolandPortugalPost-demographic dividendPre-demographic dividendPuerto RicoQatarRomaniaRussian FederationRwandaSamoaSao Tome and PrincipeSaudi ArabiaSenegalSerbiaSeychellesSierra LeoneSingaporeSlovak RepublicSloveniaSmall statesSolomon IslandsSomaliaSouth AfricaSouth AsiaSouth Asia (IDA & IBRD)South SudanSpainSri LankaSt. LuciaSt. Vincent and the GrenadinesSub-Saharan Africa Sub-Saharan Africa (excluding high income)Sub-Saharan Africa (IDA & IBRD countries)SudanSurinameSwazilandSwedenSwitzerlandSyrian Arab RepublicTajikistanTanzaniaThailandTimor-LesteTogoTongaTrinidad and TobagoTunisiaTurkeyTurkmenistanUgandaUkraineUnited Arab EmiratesUnited KingdomUnited StatesUpper middle incomeUruguayUzbekistanVanuatuVenezuela, RBVietnamVirgin Islands (U.S.)West Bank and GazaWorldYemen, Rep.ZambiaZimbabwe Timeline:
This timeline shows a graph from 1961 to 2016 of Luxembourg. No data until 1960. Number of actual observations by date: 56.
Source name:
World Development Indicators
Source organization:
World Bank staff estimates based on age distributions of United Nations Population Division's World Population Prospects.
Categories, topics:
Education, Health
Last updated:
apr 23, 2017
Indicators value changes by year
Minimum:
65.239
jan 1, 1971
Maximum:
69.664
jan 1, 1988
At the date of observation
Value
Absolute change
Change from previous value
jan 1, 1961
67.994
+67.994
0.0%
jan 1, 1962
67.545
-0.45
-0.66%
jan 1, 1963
67.127
-0.418
-0.62%
jan 1, 1964
66.753
-0.374
-0.56%
jan 1, 1965
66.436
-0.316
-0.47%
jan 1, 1966
66.186
-0.25
-0.38%
jan 1, 1967
65.832
-0.354
-0.54%
jan 1, 1968
65.557
-0.275
-0.42%
jan 1, 1969
65.366
-0.191
-0.29%
jan 1, 1970
65.262
-0.104
-0.16%
jan 1, 1971
65.239
-0.023
-0.04%
jan 1, 1972
65.275
+0.036
0.06%
jan 1, 1973
65.424
+0.149
0.23%
jan 1, 1974
65.656
+0.232
0.35%
jan 1, 1975
65.939
+0.283
0.43%
jan 1, 1976
66.255
+0.316
0.48%
jan 1, 1977
66.473
+0.219
0.33%
jan 1, 1978
66.67
+0.196
0.3%
jan 1, 1979
66.886
+0.216
0.32%
jan 1, 1980
67.187
+0.302
0.45%
jan 1, 1981
67.601
+0.414
0.62%
jan 1, 1982
67.939
+0.338
0.5%
jan 1, 1983
68.383
+0.443
0.65%
jan 1, 1984
68.855
+0.473
0.69%
jan 1, 1985
69.253
+0.398
0.58%
jan 1, 1986
69.521
+0.267
0.39%
jan 1, 1987
69.637
+0.117
0.17%
jan 1, 1988
69.664
+0.026
0.04%
jan 1, 1989
69.596
-0.067
-0.1%
jan 1, 1990
69.452
-0.144
-0.21%
jan 1, 1991
69.248
-0.205
-0.29%
jan 1, 1992
68.974
-0.273
-0.39%
jan 1, 1993
68.65
-0.324
-0.47%
jan 1, 1994
68.293
-0.357
-0.52%
jan 1, 1995
67.948
-0.345
-0.5%
jan 1, 1996
67.656
-0.292
-0.43%
jan 1, 1997
67.388
-0.268
-0.4%
jan 1, 1998
67.209
-0.179
-0.26%
jan 1, 1999
67.097
-0.112
-0.17%
jan 1, 2000
67.024
-0.073
-0.11%
jan 1, 2001
66.982
-0.042
-0.06%
jan 1, 2002
66.899
-0.083
-0.12%
jan 1, 2003
66.85
-0.05
-0.07%
jan 1, 2004
66.84
-0.01
-0.01%
jan 1, 2005
66.878
+0.038
0.06%
jan 1, 2006
66.956
+0.078
0.12%
jan 1, 2007
67.259
+0.303
0.45%
jan 1, 2008
67.574
+0.315
0.47%
jan 1, 2009
67.877
+0.303
0.45%
jan 1, 2010
68.143
+0.266
0.39%
jan 1, 2011
68.363
+0.22
0.32%
jan 1, 2012
68.642
+0.279
0.41%
jan 1, 2013
68.906
+0.264
0.38%
jan 1, 2014
69.154
+0.248
0.36%
jan 1, 2015
69.384
+0.23
0.33%
jan 1, 2016
69.585
+0.2
0.29%
Ranking of countries by current statistics by years


Comments: