29
/
en
AIzaSyAYiBZKx7MnpbEhh9jyipgxe19OcubqV5w
April 1, 2024
34528
Fragile and conflict affected situations
FCS
false
2
1
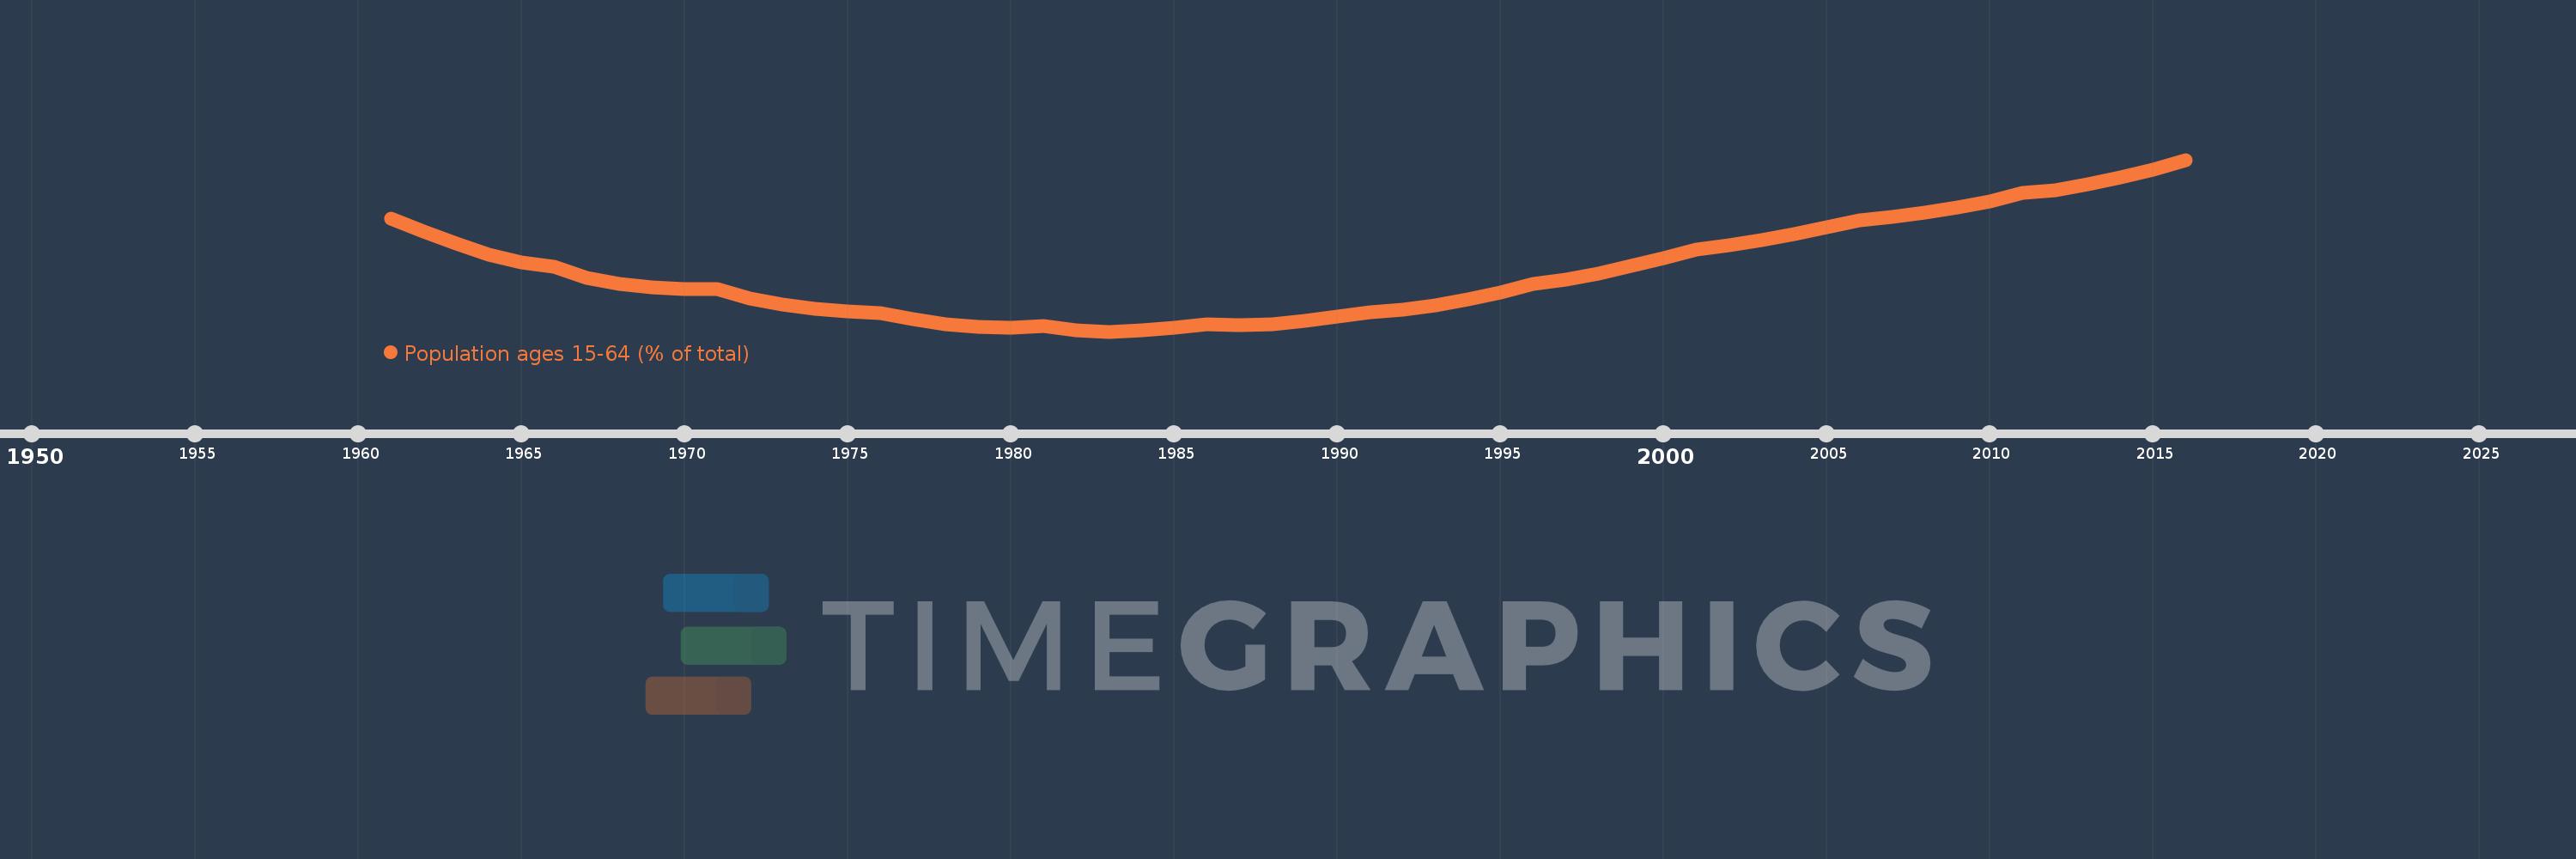
Population ages 15-64 (% of total)
2016,2015,2014,2013,2012,2011,2010,2009,2008,2007,2006,2005,2004,2003,2002,2001,2000,1999,1998,1997,1996,1995,1994,1993,1992,1991,1990,1989,1988,1987,1986,1985,1984,1983,1982,1981,1980,1979,1978,1977,1976,1975,1974,1973,1972,1971,1970,1969,1968,1967,1966,1965,1964,1963,1962,1961
This statistics in other country:
AfghanistanAlbaniaAlgeriaAngolaAntigua and BarbudaArab WorldArgentinaArmeniaArubaAustraliaAustriaAzerbaijanBahamas, TheBahrainBangladeshBarbadosBelarusBelgiumBelizeBeninBhutanBoliviaBosnia and HerzegovinaBotswanaBrazilBrunei DarussalamBulgariaBurkina FasoBurundiCabo VerdeCambodiaCameroonCanadaCaribbean small statesCentral African RepublicCentral Europe and the BalticsChadChannel IslandsChileChinaColombiaComorosCongo, Dem. Rep.Congo, Rep.Costa RicaCote d'IvoireCroatiaCubaCuracaoCyprusCzech RepublicDenmarkDjiboutiDominican RepublicEarly-demographic dividendEast Asia & PacificEast Asia & Pacific (excluding high income)East Asia & Pacific (IDA & IBRD countries)EcuadorEgypt, Arab Rep.El SalvadorEquatorial GuineaEritreaEstoniaEthiopiaEuro areaEurope & Central AsiaEurope & Central Asia (excluding high income)Europe & Central Asia (IDA & IBRD countries)European UnionFijiFinlandFragile and conflict affected situationsFranceFrench PolynesiaGabonGambia, TheGeorgiaGermanyGhanaGreeceGrenadaGuamGuatemalaGuineaGuinea-BissauGuyanaHaitiHeavily indebted poor countries (HIPC)High incomeHondurasHong Kong SAR, ChinaHungaryIBRD onlyIcelandIDA & IBRD totalIDA blendIDA onlyIDA totalIndiaIndonesiaIran, Islamic Rep.IraqIrelandIsraelItalyJamaicaJapanJordanKazakhstanKenyaKiribatiKorea, Dem. People’s Rep.Korea, Rep.KosovoKuwaitKyrgyz RepublicLao PDRLate-demographic dividendLatin America & Caribbean Latin America & Caribbean (excluding high income)Latin America & the Caribbean (IDA & IBRD countries)LatviaLeast developed countries: UN classificationLebanonLesothoLiberiaLibyaLithuaniaLow & middle incomeLow incomeLower middle incomeLuxembourgMacao SAR, ChinaMacedonia, FYRMadagascarMalawiMalaysiaMaldivesMaliMaltaMauritaniaMauritiusMexicoMicronesia, Fed. Sts.Middle East & North AfricaMiddle East & North Africa (excluding high income)Middle East & North Africa (IDA & IBRD countries)Middle incomeMoldovaMongoliaMontenegroMoroccoMozambiqueMyanmarNamibiaNepalNetherlandsNew CaledoniaNew ZealandNicaraguaNigerNigeriaNorth AmericaNorwayOECD membersOmanOther small statesPacific island small statesPakistanPanamaPapua New GuineaParaguayPeruPhilippinesPolandPortugalPost-demographic dividendPre-demographic dividendPuerto RicoQatarRomaniaRussian FederationRwandaSamoaSao Tome and PrincipeSaudi ArabiaSenegalSerbiaSeychellesSierra LeoneSingaporeSlovak RepublicSloveniaSmall statesSolomon IslandsSomaliaSouth AfricaSouth AsiaSouth Asia (IDA & IBRD)South SudanSpainSri LankaSt. LuciaSt. Vincent and the GrenadinesSub-Saharan Africa Sub-Saharan Africa (excluding high income)Sub-Saharan Africa (IDA & IBRD countries)SudanSurinameSwazilandSwedenSwitzerlandSyrian Arab RepublicTajikistanTanzaniaThailandTimor-LesteTogoTongaTrinidad and TobagoTunisiaTurkeyTurkmenistanUgandaUkraineUnited Arab EmiratesUnited KingdomUnited StatesUpper middle incomeUruguayUzbekistanVanuatuVenezuela, RBVietnamVirgin Islands (U.S.)West Bank and GazaWorldYemen, Rep.ZambiaZimbabwe Timeline:
This timeline shows a graph from 1961 to 2016 of Fragile and conflict affected situations. No data until 1960. Number of actual observations by date: 56.
Source name:
World Development Indicators
Source organization:
World Bank staff estimates based on age distributions of United Nations Population Division's World Population Prospects.
Categories, topics:
Education, Health
Last updated:
apr 23, 2017
Indicators value changes by year
Minimum:
51.763
jan 1, 1983
Maximum:
56.151
jan 1, 2016
At the date of observation
Value
Absolute change
Change from previous value
jan 1, 1961
54.64
+54.64
0.0%
jan 1, 1962
54.32
-0.32
-0.59%
jan 1, 1963
54.002
-0.318
-0.59%
jan 1, 1964
53.718
-0.284
-0.53%
jan 1, 1965
53.52
-0.198
-0.37%
jan 1, 1966
53.423
-0.097
-0.18%
jan 1, 1967
53.135
-0.288
-0.54%
jan 1, 1968
52.971
-0.164
-0.31%
jan 1, 1969
52.895
-0.077
-0.15%
jan 1, 1970
52.858
-0.036
-0.07%
jan 1, 1971
52.84
-0.019
-0.04%
jan 1, 1972
52.611
-0.228
-0.43%
jan 1, 1973
52.453
-0.158
-0.3%
jan 1, 1974
52.347
-0.106
-0.2%
jan 1, 1975
52.279
-0.068
-0.13%
jan 1, 1976
52.239
-0.04
-0.08%
jan 1, 1977
52.073
-0.166
-0.32%
jan 1, 1978
51.954
-0.119
-0.23%
jan 1, 1979
51.881
-0.073
-0.14%
jan 1, 1980
51.862
-0.019
-0.04%
jan 1, 1981
51.904
+0.042
0.08%
jan 1, 1982
51.798
-0.106
-0.2%
jan 1, 1983
51.763
-0.034
-0.07%
jan 1, 1984
51.789
+0.026
0.05%
jan 1, 1985
51.858
+0.069
0.13%
jan 1, 1986
51.959
+0.1
0.19%
jan 1, 1987
51.926
-0.033
-0.06%
jan 1, 1988
51.957
+0.031
0.06%
jan 1, 1989
52.037
+0.08
0.15%
jan 1, 1990
52.15
+0.114
0.22%
jan 1, 1991
52.262
+0.112
0.21%
jan 1, 1992
52.332
+0.07
0.13%
jan 1, 1993
52.442
+0.11
0.21%
jan 1, 1994
52.588
+0.145
0.28%
jan 1, 1995
52.768
+0.18
0.34%
jan 1, 1996
52.985
+0.217
0.41%
jan 1, 1997
53.097
+0.112
0.21%
jan 1, 1998
53.248
+0.151
0.29%
jan 1, 1999
53.434
+0.186
0.35%
jan 1, 2000
53.643
+0.209
0.39%
jan 1, 2001
53.864
+0.22
0.41%
jan 1, 2002
53.961
+0.097
0.18%
jan 1, 2003
54.094
+0.133
0.25%
jan 1, 2004
54.25
+0.156
0.29%
jan 1, 2005
54.418
+0.169
0.31%
jan 1, 2006
54.596
+0.178
0.33%
jan 1, 2007
54.688
+0.092
0.17%
jan 1, 2008
54.799
+0.11
0.2%
jan 1, 2009
54.929
+0.13
0.24%
jan 1, 2010
55.085
+0.156
0.28%
jan 1, 2011
55.31
+0.226
0.41%
jan 1, 2012
55.376
+0.065
0.12%
jan 1, 2013
55.526
+0.15
0.27%
jan 1, 2014
55.707
+0.181
0.33%
jan 1, 2015
55.905
+0.198
0.35%
jan 1, 2016
56.151
+0.246
0.44%
Ranking of countries by current statistics by years


Comments: