29
/
en
AIzaSyAYiBZKx7MnpbEhh9jyipgxe19OcubqV5w
April 1, 2024
102875
Central African Republic
CAF
true
2
1
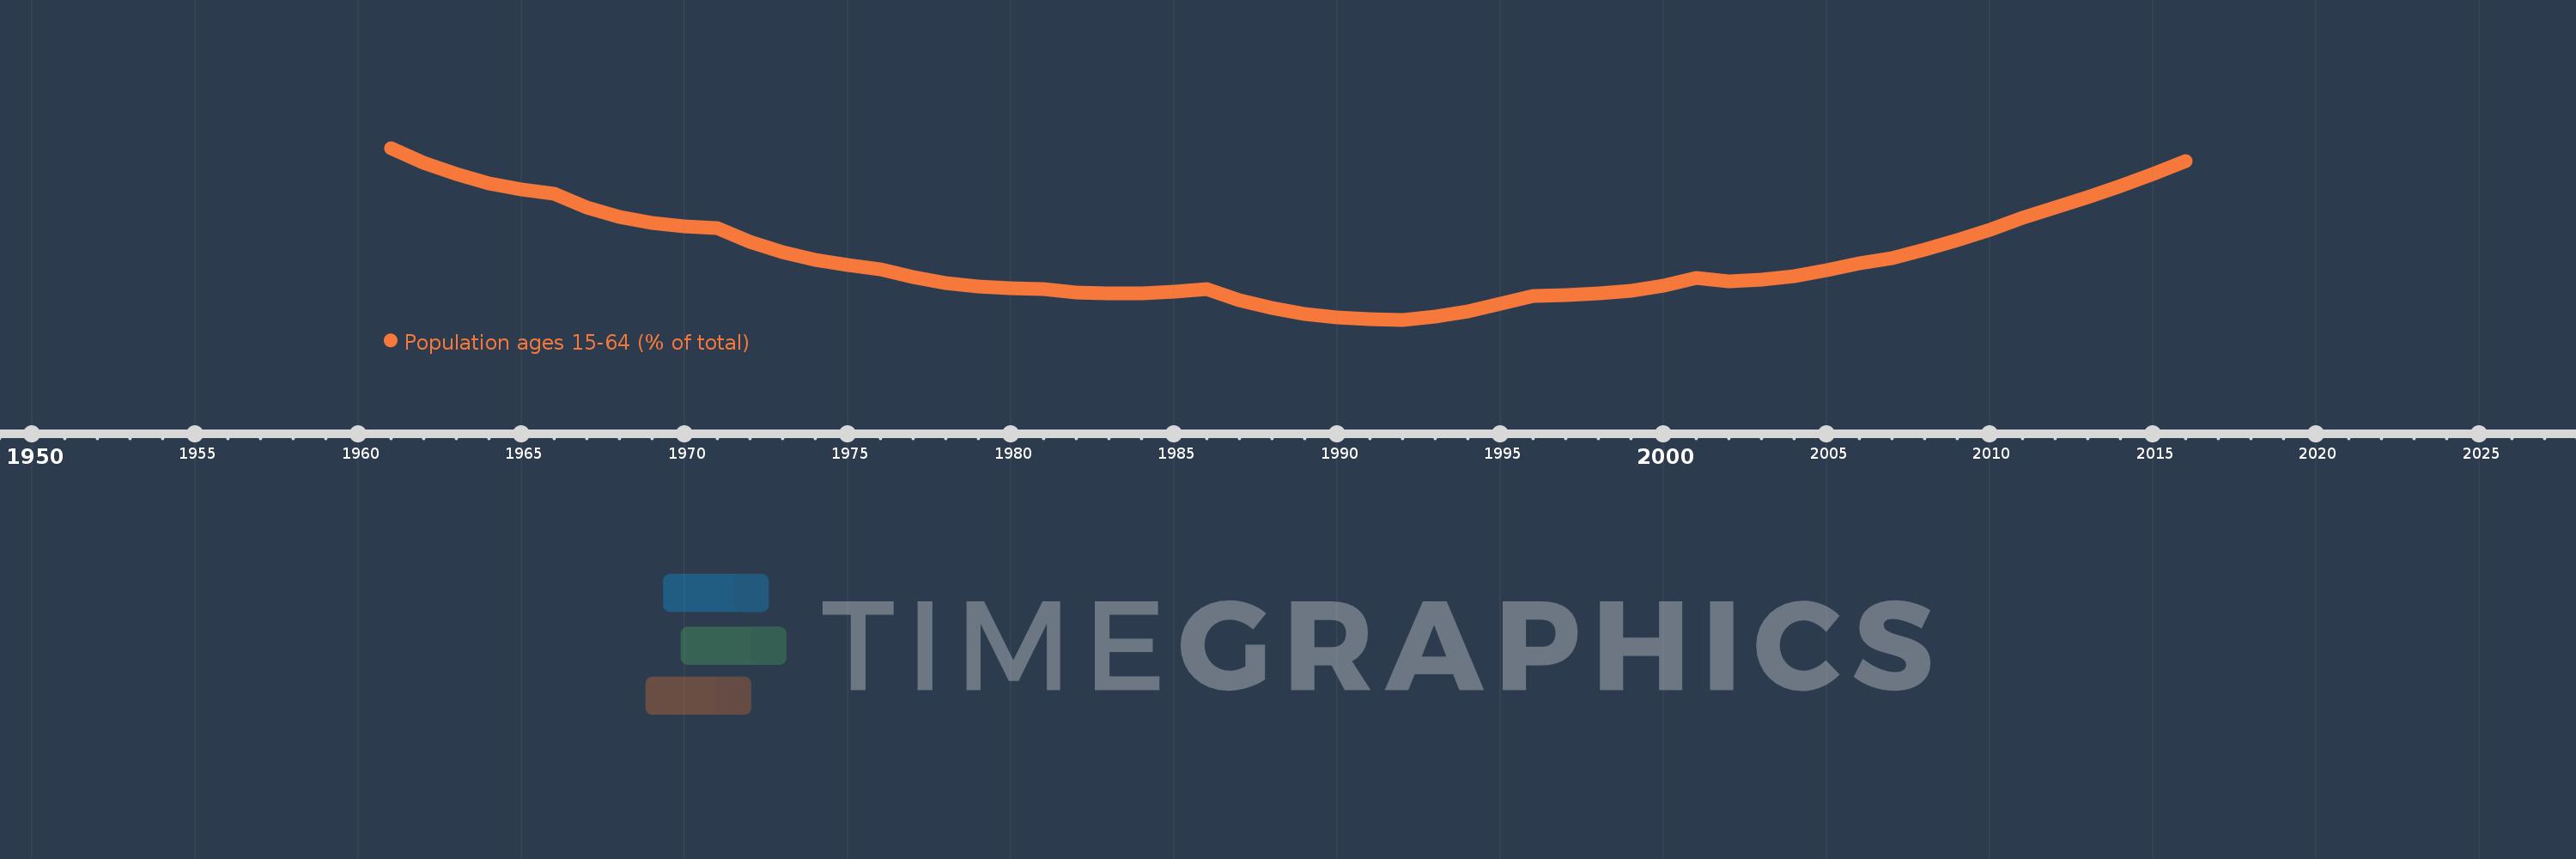
Population ages 15-64 (% of total)
2016,2015,2014,2013,2012,2011,2010,2009,2008,2007,2006,2005,2004,2003,2002,2001,2000,1999,1998,1997,1996,1995,1994,1993,1992,1991,1990,1989,1988,1987,1986,1985,1984,1983,1982,1981,1980,1979,1978,1977,1976,1975,1974,1973,1972,1971,1970,1969,1968,1967,1966,1965,1964,1963,1962,1961
This statistics in other country:
AfghanistanAlbaniaAlgeriaAngolaAntigua and BarbudaArab WorldArgentinaArmeniaArubaAustraliaAustriaAzerbaijanBahamas, TheBahrainBangladeshBarbadosBelarusBelgiumBelizeBeninBhutanBoliviaBosnia and HerzegovinaBotswanaBrazilBrunei DarussalamBulgariaBurkina FasoBurundiCabo VerdeCambodiaCameroonCanadaCaribbean small statesCentral African RepublicCentral Europe and the BalticsChadChannel IslandsChileChinaColombiaComorosCongo, Dem. Rep.Congo, Rep.Costa RicaCote d'IvoireCroatiaCubaCuracaoCyprusCzech RepublicDenmarkDjiboutiDominican RepublicEarly-demographic dividendEast Asia & PacificEast Asia & Pacific (excluding high income)East Asia & Pacific (IDA & IBRD countries)EcuadorEgypt, Arab Rep.El SalvadorEquatorial GuineaEritreaEstoniaEthiopiaEuro areaEurope & Central AsiaEurope & Central Asia (excluding high income)Europe & Central Asia (IDA & IBRD countries)European UnionFijiFinlandFragile and conflict affected situationsFranceFrench PolynesiaGabonGambia, TheGeorgiaGermanyGhanaGreeceGrenadaGuamGuatemalaGuineaGuinea-BissauGuyanaHaitiHeavily indebted poor countries (HIPC)High incomeHondurasHong Kong SAR, ChinaHungaryIBRD onlyIcelandIDA & IBRD totalIDA blendIDA onlyIDA totalIndiaIndonesiaIran, Islamic Rep.IraqIrelandIsraelItalyJamaicaJapanJordanKazakhstanKenyaKiribatiKorea, Dem. People’s Rep.Korea, Rep.KosovoKuwaitKyrgyz RepublicLao PDRLate-demographic dividendLatin America & Caribbean Latin America & Caribbean (excluding high income)Latin America & the Caribbean (IDA & IBRD countries)LatviaLeast developed countries: UN classificationLebanonLesothoLiberiaLibyaLithuaniaLow & middle incomeLow incomeLower middle incomeLuxembourgMacao SAR, ChinaMacedonia, FYRMadagascarMalawiMalaysiaMaldivesMaliMaltaMauritaniaMauritiusMexicoMicronesia, Fed. Sts.Middle East & North AfricaMiddle East & North Africa (excluding high income)Middle East & North Africa (IDA & IBRD countries)Middle incomeMoldovaMongoliaMontenegroMoroccoMozambiqueMyanmarNamibiaNepalNetherlandsNew CaledoniaNew ZealandNicaraguaNigerNigeriaNorth AmericaNorwayOECD membersOmanOther small statesPacific island small statesPakistanPanamaPapua New GuineaParaguayPeruPhilippinesPolandPortugalPost-demographic dividendPre-demographic dividendPuerto RicoQatarRomaniaRussian FederationRwandaSamoaSao Tome and PrincipeSaudi ArabiaSenegalSerbiaSeychellesSierra LeoneSingaporeSlovak RepublicSloveniaSmall statesSolomon IslandsSomaliaSouth AfricaSouth AsiaSouth Asia (IDA & IBRD)South SudanSpainSri LankaSt. LuciaSt. Vincent and the GrenadinesSub-Saharan Africa Sub-Saharan Africa (excluding high income)Sub-Saharan Africa (IDA & IBRD countries)SudanSurinameSwazilandSwedenSwitzerlandSyrian Arab RepublicTajikistanTanzaniaThailandTimor-LesteTogoTongaTrinidad and TobagoTunisiaTurkeyTurkmenistanUgandaUkraineUnited Arab EmiratesUnited KingdomUnited StatesUpper middle incomeUruguayUzbekistanVanuatuVenezuela, RBVietnamVirgin Islands (U.S.)West Bank and GazaWorldYemen, Rep.ZambiaZimbabwe Timeline:
This timeline shows a graph from 1961 to 2016 of Central African Republic. No data until 1960. Number of actual observations by date: 56.
Source name:
World Development Indicators
Source organization:
World Bank staff estimates based on age distributions of United Nations Population Division's World Population Prospects.
Categories, topics:
Education, Health
Last updated:
apr 23, 2017
Indicators value changes by year
Minimum:
52.799
jan 1, 1992
At the date of observation
Value
Absolute change
Change from previous value
jan 1, 1961
57.46
+57.46
0.0%
jan 1, 1962
57.067
-0.393
-0.68%
jan 1, 1963
56.752
-0.315
-0.55%
jan 1, 1964
56.503
-0.249
-0.44%
jan 1, 1965
56.324
-0.18
-0.32%
jan 1, 1966
56.213
-0.111
-0.2%
jan 1, 1967
55.845
-0.368
-0.65%
jan 1, 1968
55.588
-0.257
-0.46%
jan 1, 1969
55.42
-0.168
-0.3%
jan 1, 1970
55.324
-0.096
-0.17%
jan 1, 1971
55.29
-0.035
-0.06%
jan 1, 1972
54.905
-0.385
-0.7%
jan 1, 1973
54.622
-0.283
-0.52%
jan 1, 1974
54.419
-0.203
-0.37%
jan 1, 1975
54.275
-0.144
-0.26%
jan 1, 1976
54.175
-0.1
-0.19%
jan 1, 1977
53.946
-0.229
-0.42%
jan 1, 1978
53.797
-0.149
-0.28%
jan 1, 1979
53.706
-0.091
-0.17%
jan 1, 1980
53.653
-0.053
-0.1%
jan 1, 1981
53.621
-0.032
-0.06%
jan 1, 1982
53.543
-0.078
-0.15%
jan 1, 1983
53.512
-0.031
-0.06%
jan 1, 1984
53.517
+0.005
0.01%
jan 1, 1985
53.556
+0.039
0.07%
jan 1, 1986
53.633
+0.076
0.14%
jan 1, 1987
53.336
-0.297
-0.55%
jan 1, 1988
53.112
-0.224
-0.42%
jan 1, 1989
52.955
-0.157
-0.3%
jan 1, 1990
52.857
-0.098
-0.18%
jan 1, 1991
52.813
-0.044
-0.08%
jan 1, 1992
52.799
-0.014
-0.03%
jan 1, 1993
52.88
+0.081
0.15%
jan 1, 1994
53.032
+0.152
0.29%
jan 1, 1995
53.228
+0.196
0.37%
jan 1, 1996
53.453
+0.225
0.42%
jan 1, 1997
53.466
+0.013
0.02%
jan 1, 1998
53.503
+0.037
0.07%
jan 1, 1999
53.58
+0.077
0.14%
jan 1, 2000
53.724
+0.144
0.27%
jan 1, 2001
53.943
+0.22
0.41%
jan 1, 2002
53.85
-0.094
-0.17%
jan 1, 2003
53.876
+0.026
0.05%
jan 1, 2004
53.988
+0.112
0.21%
jan 1, 2005
54.142
+0.154
0.29%
jan 1, 2006
54.319
+0.176
0.33%
jan 1, 2007
54.481
+0.162
0.3%
jan 1, 2008
54.693
+0.213
0.39%
jan 1, 2009
54.948
+0.255
0.47%
jan 1, 2010
55.243
+0.295
0.54%
jan 1, 2011
55.571
+0.328
0.59%
jan 1, 2012
55.842
+0.271
0.49%
jan 1, 2013
56.124
+0.282
0.51%
jan 1, 2014
56.421
+0.297
0.53%
jan 1, 2015
56.743
+0.322
0.57%
jan 1, 2016
57.092
+0.349
0.61%
Ranking of countries by current statistics by years


Comments: