29
/
en
AIzaSyAYiBZKx7MnpbEhh9jyipgxe19OcubqV5w
April 1, 2024
281480
Venezuela, RB
VEN
true
2
1
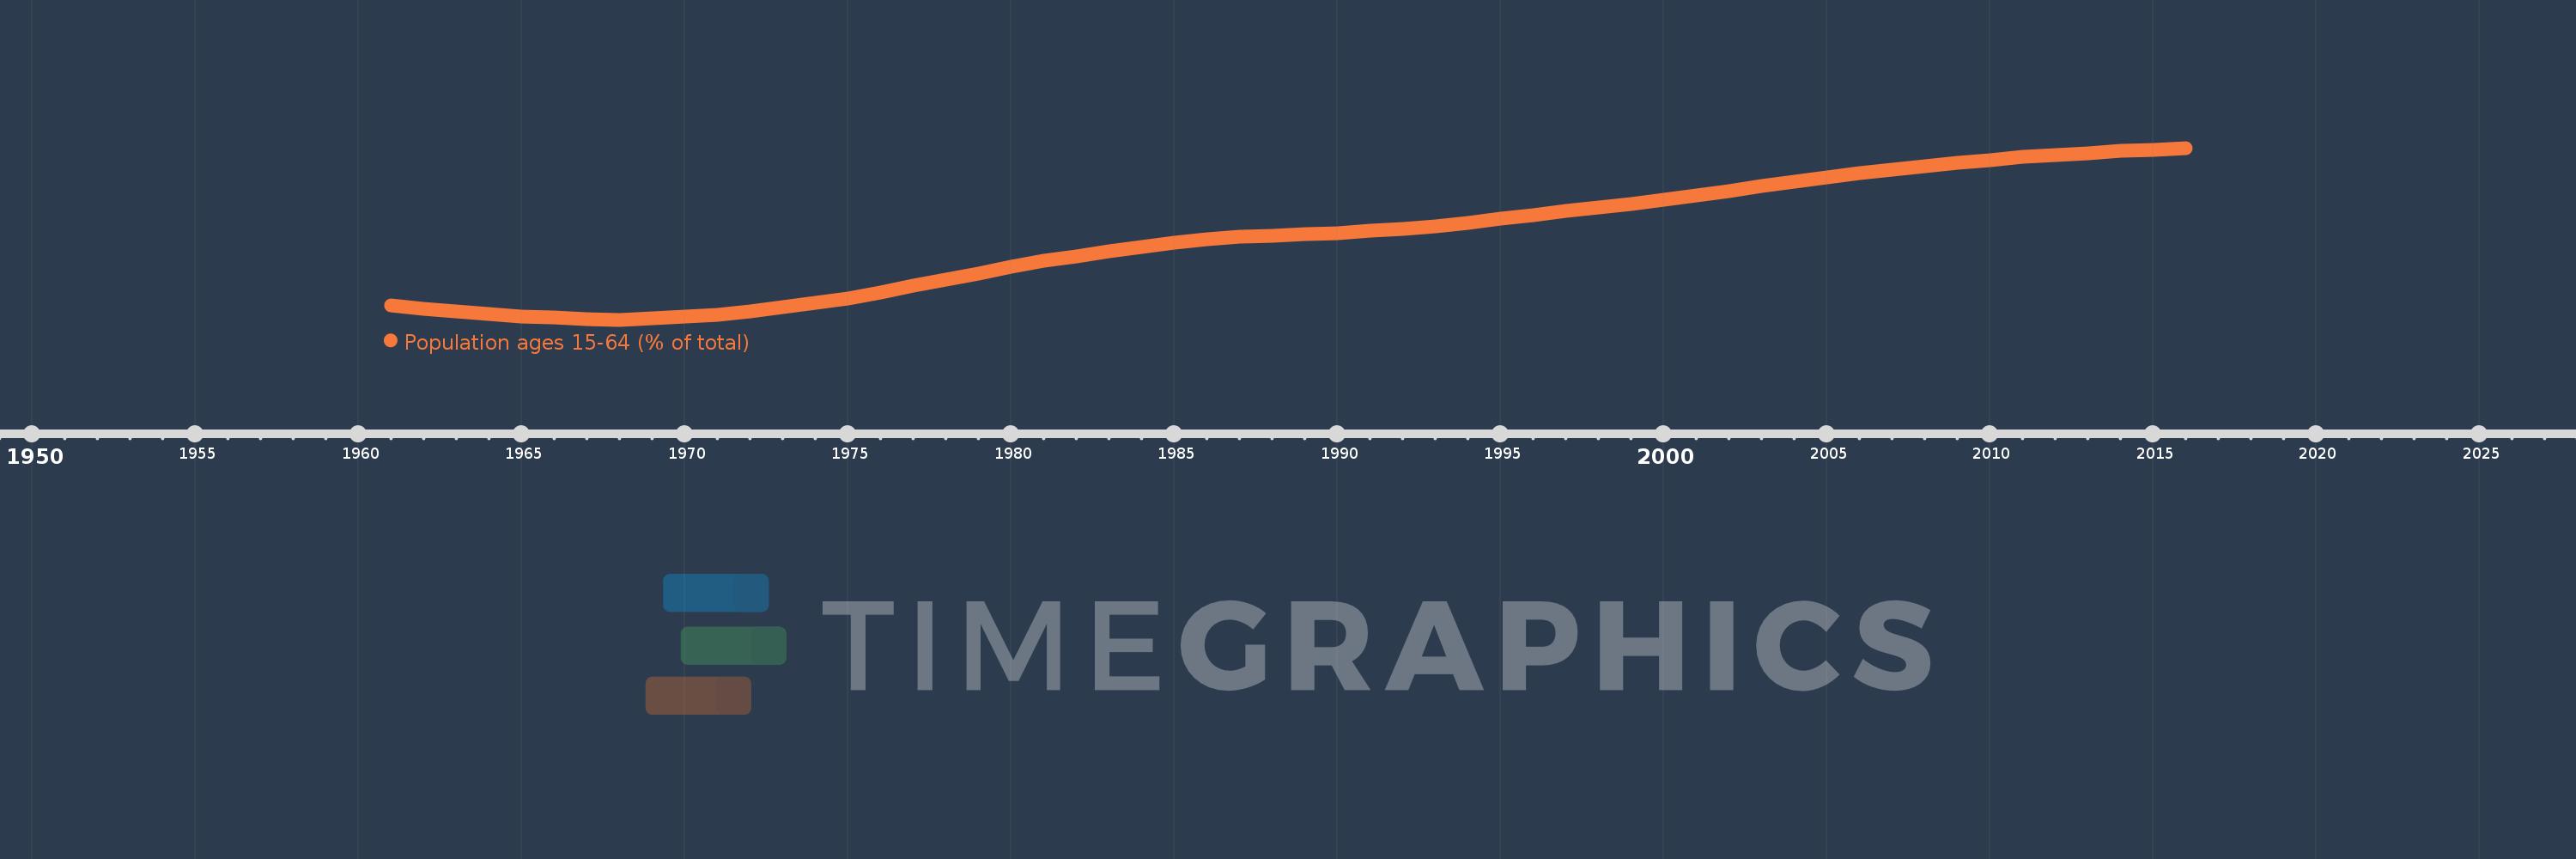
Population ages 15-64 (% of total)
2016,2015,2014,2013,2012,2011,2010,2009,2008,2007,2006,2005,2004,2003,2002,2001,2000,1999,1998,1997,1996,1995,1994,1993,1992,1991,1990,1989,1988,1987,1986,1985,1984,1983,1982,1981,1980,1979,1978,1977,1976,1975,1974,1973,1972,1971,1970,1969,1968,1967,1966,1965,1964,1963,1962,1961
This statistics in other country:
AfghanistanAlbaniaAlgeriaAngolaAntigua and BarbudaArab WorldArgentinaArmeniaArubaAustraliaAustriaAzerbaijanBahamas, TheBahrainBangladeshBarbadosBelarusBelgiumBelizeBeninBhutanBoliviaBosnia and HerzegovinaBotswanaBrazilBrunei DarussalamBulgariaBurkina FasoBurundiCabo VerdeCambodiaCameroonCanadaCaribbean small statesCentral African RepublicCentral Europe and the BalticsChadChannel IslandsChileChinaColombiaComorosCongo, Dem. Rep.Congo, Rep.Costa RicaCote d'IvoireCroatiaCubaCuracaoCyprusCzech RepublicDenmarkDjiboutiDominican RepublicEarly-demographic dividendEast Asia & PacificEast Asia & Pacific (excluding high income)East Asia & Pacific (IDA & IBRD countries)EcuadorEgypt, Arab Rep.El SalvadorEquatorial GuineaEritreaEstoniaEthiopiaEuro areaEurope & Central AsiaEurope & Central Asia (excluding high income)Europe & Central Asia (IDA & IBRD countries)European UnionFijiFinlandFragile and conflict affected situationsFranceFrench PolynesiaGabonGambia, TheGeorgiaGermanyGhanaGreeceGrenadaGuamGuatemalaGuineaGuinea-BissauGuyanaHaitiHeavily indebted poor countries (HIPC)High incomeHondurasHong Kong SAR, ChinaHungaryIBRD onlyIcelandIDA & IBRD totalIDA blendIDA onlyIDA totalIndiaIndonesiaIran, Islamic Rep.IraqIrelandIsraelItalyJamaicaJapanJordanKazakhstanKenyaKiribatiKorea, Dem. People’s Rep.Korea, Rep.KosovoKuwaitKyrgyz RepublicLao PDRLate-demographic dividendLatin America & Caribbean Latin America & Caribbean (excluding high income)Latin America & the Caribbean (IDA & IBRD countries)LatviaLeast developed countries: UN classificationLebanonLesothoLiberiaLibyaLithuaniaLow & middle incomeLow incomeLower middle incomeLuxembourgMacao SAR, ChinaMacedonia, FYRMadagascarMalawiMalaysiaMaldivesMaliMaltaMauritaniaMauritiusMexicoMicronesia, Fed. Sts.Middle East & North AfricaMiddle East & North Africa (excluding high income)Middle East & North Africa (IDA & IBRD countries)Middle incomeMoldovaMongoliaMontenegroMoroccoMozambiqueMyanmarNamibiaNepalNetherlandsNew CaledoniaNew ZealandNicaraguaNigerNigeriaNorth AmericaNorwayOECD membersOmanOther small statesPacific island small statesPakistanPanamaPapua New GuineaParaguayPeruPhilippinesPolandPortugalPost-demographic dividendPre-demographic dividendPuerto RicoQatarRomaniaRussian FederationRwandaSamoaSao Tome and PrincipeSaudi ArabiaSenegalSerbiaSeychellesSierra LeoneSingaporeSlovak RepublicSloveniaSmall statesSolomon IslandsSomaliaSouth AfricaSouth AsiaSouth Asia (IDA & IBRD)South SudanSpainSri LankaSt. LuciaSt. Vincent and the GrenadinesSub-Saharan Africa Sub-Saharan Africa (excluding high income)Sub-Saharan Africa (IDA & IBRD countries)SudanSurinameSwazilandSwedenSwitzerlandSyrian Arab RepublicTajikistanTanzaniaThailandTimor-LesteTogoTongaTrinidad and TobagoTunisiaTurkeyTurkmenistanUgandaUkraineUnited Arab EmiratesUnited KingdomUnited StatesUpper middle incomeUruguayUzbekistanVanuatuVenezuela, RBVietnamVirgin Islands (U.S.)West Bank and GazaWorldYemen, Rep.ZambiaZimbabwe Timeline:
This timeline shows a graph from 1961 to 2016 of Venezuela, RB. No data until 1960. Number of actual observations by date: 56.
Source name:
World Development Indicators
Source organization:
World Bank staff estimates based on age distributions of United Nations Population Division's World Population Prospects.
Categories, topics:
Education, Health
Last updated:
apr 23, 2017
Indicators value changes by year
Minimum:
50.666
jan 1, 1968
Maximum:
65.628
jan 1, 2016
At the date of observation
Value
Absolute change
Change from previous value
jan 1, 1961
51.895
+51.895
0.0%
jan 1, 1962
51.628
-0.267
-0.51%
jan 1, 1963
51.366
-0.262
-0.51%
jan 1, 1964
51.131
-0.235
-0.46%
jan 1, 1965
50.961
-0.17
-0.33%
jan 1, 1966
50.879
-0.081
-0.16%
jan 1, 1967
50.69
-0.189
-0.37%
jan 1, 1968
50.666
-0.024
-0.05%
jan 1, 1969
50.757
+0.091
0.18%
jan 1, 1970
50.911
+0.154
0.3%
jan 1, 1971
51.114
+0.202
0.4%
jan 1, 1972
51.414
+0.3
0.59%
jan 1, 1973
51.738
+0.324
0.63%
jan 1, 1974
52.108
+0.371
0.72%
jan 1, 1975
52.55
+0.442
0.85%
jan 1, 1976
53.059
+0.509
0.97%
jan 1, 1977
53.605
+0.547
1.03%
jan 1, 1978
54.153
+0.547
1.02%
jan 1, 1979
54.703
+0.55
1.02%
jan 1, 1980
55.254
+0.551
1.01%
jan 1, 1981
55.797
+0.543
0.98%
jan 1, 1982
56.177
+0.38
0.68%
jan 1, 1983
56.609
+0.432
0.77%
jan 1, 1984
57.038
+0.429
0.76%
jan 1, 1985
57.398
+0.36
0.63%
jan 1, 1986
57.664
+0.266
0.46%
jan 1, 1987
57.884
+0.219
0.38%
jan 1, 1988
58.009
+0.126
0.22%
jan 1, 1989
58.091
+0.082
0.14%
jan 1, 1990
58.209
+0.117
0.2%
jan 1, 1991
58.402
+0.193
0.33%
jan 1, 1992
58.554
+0.152
0.26%
jan 1, 1993
58.808
+0.254
0.43%
jan 1, 1994
59.129
+0.321
0.55%
jan 1, 1995
59.464
+0.335
0.57%
jan 1, 1996
59.79
+0.326
0.55%
jan 1, 1997
60.137
+0.347
0.58%
jan 1, 1998
60.458
+0.322
0.54%
jan 1, 1999
60.778
+0.32
0.53%
jan 1, 2000
61.129
+0.35
0.58%
jan 1, 2001
61.519
+0.39
0.64%
jan 1, 2002
61.889
+0.37
0.6%
jan 1, 2003
62.286
+0.397
0.64%
jan 1, 2004
62.694
+0.408
0.65%
jan 1, 2005
63.088
+0.395
0.63%
jan 1, 2006
63.456
+0.367
0.58%
jan 1, 2007
63.766
+0.311
0.49%
jan 1, 2008
64.064
+0.297
0.47%
jan 1, 2009
64.341
+0.277
0.43%
jan 1, 2010
64.594
+0.254
0.39%
jan 1, 2011
64.824
+0.23
0.36%
jan 1, 2012
65.02
+0.196
0.3%
jan 1, 2013
65.192
+0.172
0.26%
jan 1, 2014
65.345
+0.153
0.23%
jan 1, 2015
65.488
+0.144
0.22%
jan 1, 2016
65.628
+0.139
0.21%
Ranking of countries by current statistics by years


Comments: