29
/
en
AIzaSyAYiBZKx7MnpbEhh9jyipgxe19OcubqV5w
April 1, 2024
239765
Sierra Leone
SLE
true
2
1
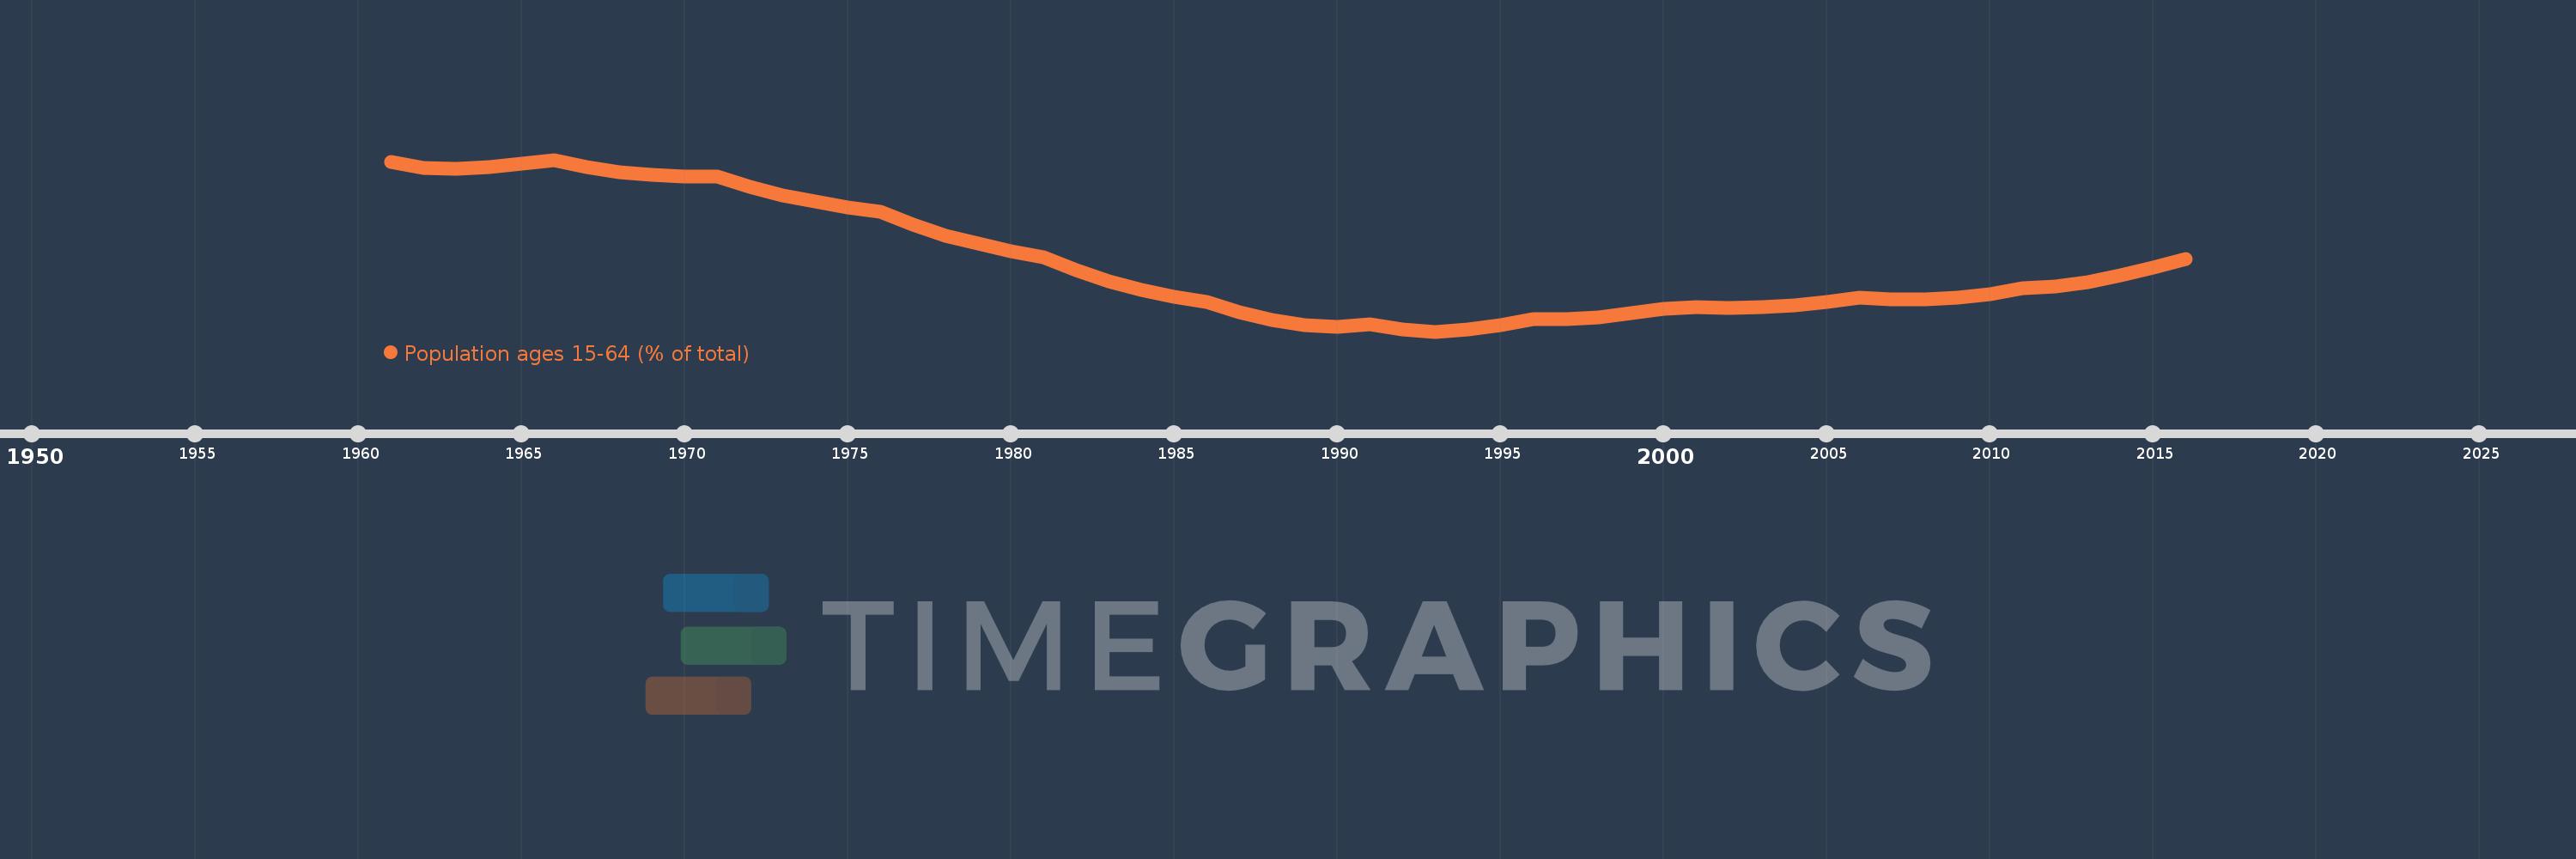
Population ages 15-64 (% of total)
2016,2015,2014,2013,2012,2011,2010,2009,2008,2007,2006,2005,2004,2003,2002,2001,2000,1999,1998,1997,1996,1995,1994,1993,1992,1991,1990,1989,1988,1987,1986,1985,1984,1983,1982,1981,1980,1979,1978,1977,1976,1975,1974,1973,1972,1971,1970,1969,1968,1967,1966,1965,1964,1963,1962,1961
This statistics in other country:
AfghanistanAlbaniaAlgeriaAngolaAntigua and BarbudaArab WorldArgentinaArmeniaArubaAustraliaAustriaAzerbaijanBahamas, TheBahrainBangladeshBarbadosBelarusBelgiumBelizeBeninBhutanBoliviaBosnia and HerzegovinaBotswanaBrazilBrunei DarussalamBulgariaBurkina FasoBurundiCabo VerdeCambodiaCameroonCanadaCaribbean small statesCentral African RepublicCentral Europe and the BalticsChadChannel IslandsChileChinaColombiaComorosCongo, Dem. Rep.Congo, Rep.Costa RicaCote d'IvoireCroatiaCubaCuracaoCyprusCzech RepublicDenmarkDjiboutiDominican RepublicEarly-demographic dividendEast Asia & PacificEast Asia & Pacific (excluding high income)East Asia & Pacific (IDA & IBRD countries)EcuadorEgypt, Arab Rep.El SalvadorEquatorial GuineaEritreaEstoniaEthiopiaEuro areaEurope & Central AsiaEurope & Central Asia (excluding high income)Europe & Central Asia (IDA & IBRD countries)European UnionFijiFinlandFragile and conflict affected situationsFranceFrench PolynesiaGabonGambia, TheGeorgiaGermanyGhanaGreeceGrenadaGuamGuatemalaGuineaGuinea-BissauGuyanaHaitiHeavily indebted poor countries (HIPC)High incomeHondurasHong Kong SAR, ChinaHungaryIBRD onlyIcelandIDA & IBRD totalIDA blendIDA onlyIDA totalIndiaIndonesiaIran, Islamic Rep.IraqIrelandIsraelItalyJamaicaJapanJordanKazakhstanKenyaKiribatiKorea, Dem. People’s Rep.Korea, Rep.KosovoKuwaitKyrgyz RepublicLao PDRLate-demographic dividendLatin America & Caribbean Latin America & Caribbean (excluding high income)Latin America & the Caribbean (IDA & IBRD countries)LatviaLeast developed countries: UN classificationLebanonLesothoLiberiaLibyaLithuaniaLow & middle incomeLow incomeLower middle incomeLuxembourgMacao SAR, ChinaMacedonia, FYRMadagascarMalawiMalaysiaMaldivesMaliMaltaMauritaniaMauritiusMexicoMicronesia, Fed. Sts.Middle East & North AfricaMiddle East & North Africa (excluding high income)Middle East & North Africa (IDA & IBRD countries)Middle incomeMoldovaMongoliaMontenegroMoroccoMozambiqueMyanmarNamibiaNepalNetherlandsNew CaledoniaNew ZealandNicaraguaNigerNigeriaNorth AmericaNorwayOECD membersOmanOther small statesPacific island small statesPakistanPanamaPapua New GuineaParaguayPeruPhilippinesPolandPortugalPost-demographic dividendPre-demographic dividendPuerto RicoQatarRomaniaRussian FederationRwandaSamoaSao Tome and PrincipeSaudi ArabiaSenegalSerbiaSeychellesSierra LeoneSingaporeSlovak RepublicSloveniaSmall statesSolomon IslandsSomaliaSouth AfricaSouth AsiaSouth Asia (IDA & IBRD)South SudanSpainSri LankaSt. LuciaSt. Vincent and the GrenadinesSub-Saharan Africa Sub-Saharan Africa (excluding high income)Sub-Saharan Africa (IDA & IBRD countries)SudanSurinameSwazilandSwedenSwitzerlandSyrian Arab RepublicTajikistanTanzaniaThailandTimor-LesteTogoTongaTrinidad and TobagoTunisiaTurkeyTurkmenistanUgandaUkraineUnited Arab EmiratesUnited KingdomUnited StatesUpper middle incomeUruguayUzbekistanVanuatuVenezuela, RBVietnamVirgin Islands (U.S.)West Bank and GazaWorldYemen, Rep.ZambiaZimbabwe Timeline:
This timeline shows a graph from 1961 to 2016 of Sierra Leone. No data until 1960. Number of actual observations by date: 56.
Source name:
World Development Indicators
Source organization:
World Bank staff estimates based on age distributions of United Nations Population Division's World Population Prospects.
Categories, topics:
Education, Health
Last updated:
apr 23, 2017
Indicators value changes by year
Maximum:
58.471
jan 1, 1966
At the date of observation
Value
Absolute change
Change from previous value
jan 1, 1961
58.403
+58.403
0.0%
jan 1, 1962
58.198
-0.205
-0.35%
jan 1, 1963
58.152
-0.046
-0.08%
jan 1, 1964
58.215
+0.063
0.11%
jan 1, 1965
58.331
+0.116
0.2%
jan 1, 1966
58.471
+0.14
0.24%
jan 1, 1967
58.207
-0.263
-0.45%
jan 1, 1968
58.036
-0.171
-0.29%
jan 1, 1969
57.935
-0.101
-0.17%
jan 1, 1970
57.889
-0.046
-0.08%
jan 1, 1971
57.881
-0.008
-0.01%
jan 1, 1972
57.512
-0.369
-0.64%
jan 1, 1973
57.223
-0.289
-0.5%
jan 1, 1974
56.99
-0.233
-0.41%
jan 1, 1975
56.799
-0.191
-0.33%
jan 1, 1976
56.642
-0.157
-0.28%
jan 1, 1977
56.175
-0.467
-0.82%
jan 1, 1978
55.807
-0.368
-0.65%
jan 1, 1979
55.509
-0.298
-0.53%
jan 1, 1980
55.252
-0.256
-0.46%
jan 1, 1981
55.026
-0.227
-0.41%
jan 1, 1982
54.573
-0.452
-0.82%
jan 1, 1983
54.2
-0.373
-0.68%
jan 1, 1984
53.899
-0.301
-0.56%
jan 1, 1985
53.66
-0.238
-0.44%
jan 1, 1986
53.47
-0.19
-0.35%
jan 1, 1987
53.105
-0.365
-0.68%
jan 1, 1988
52.829
-0.276
-0.52%
jan 1, 1989
52.642
-0.188
-0.35%
jan 1, 1990
52.577
-0.065
-0.12%
jan 1, 1991
52.684
+0.107
0.2%
jan 1, 1992
52.485
-0.198
-0.38%
jan 1, 1993
52.42
-0.066
-0.13%
jan 1, 1994
52.492
+0.072
0.14%
jan 1, 1995
52.66
+0.169
0.32%
jan 1, 1996
52.862
+0.202
0.38%
jan 1, 1997
52.85
-0.012
-0.02%
jan 1, 1998
52.934
+0.084
0.16%
jan 1, 1999
53.072
+0.139
0.26%
jan 1, 2000
53.214
+0.141
0.27%
jan 1, 2001
53.295
+0.082
0.15%
jan 1, 2002
53.244
-0.051
-0.1%
jan 1, 2003
53.277
+0.032
0.06%
jan 1, 2004
53.347
+0.07
0.13%
jan 1, 2005
53.45
+0.103
0.19%
jan 1, 2006
53.615
+0.165
0.31%
jan 1, 2007
53.564
-0.05
-0.09%
jan 1, 2008
53.553
-0.011
-0.02%
jan 1, 2009
53.607
+0.054
0.1%
jan 1, 2010
53.74
+0.133
0.25%
jan 1, 2011
53.946
+0.206
0.38%
jan 1, 2012
54.008
+0.062
0.12%
jan 1, 2013
54.165
+0.157
0.29%
jan 1, 2014
54.395
+0.229
0.42%
jan 1, 2015
54.667
+0.272
0.5%
jan 1, 2016
54.968
+0.3
0.55%
Ranking of countries by current statistics by years


Comments: