29
/
en
AIzaSyAYiBZKx7MnpbEhh9jyipgxe19OcubqV5w
April 1, 2024
133526
Finland
FIN
true
2
1
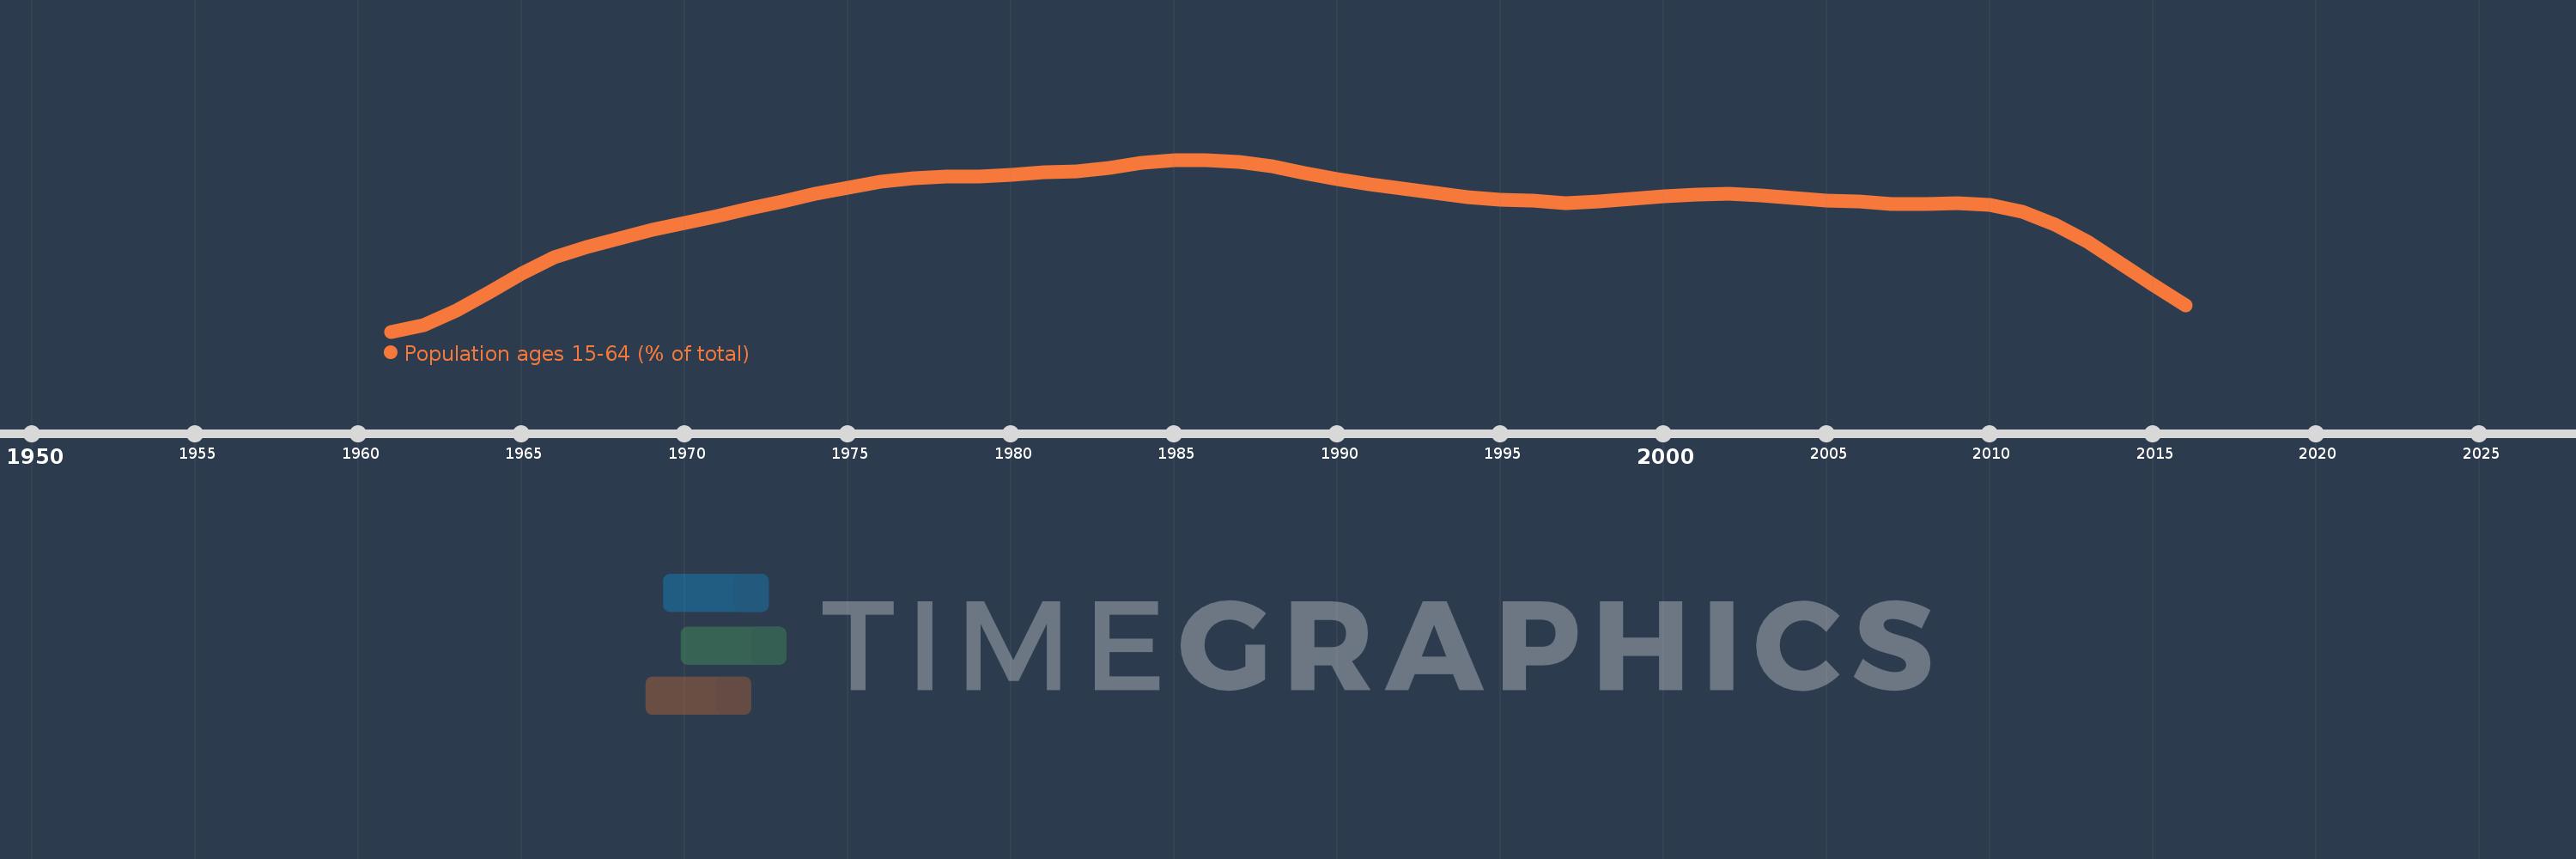
Population ages 15-64 (% of total)
2016,2015,2014,2013,2012,2011,2010,2009,2008,2007,2006,2005,2004,2003,2002,2001,2000,1999,1998,1997,1996,1995,1994,1993,1992,1991,1990,1989,1988,1987,1986,1985,1984,1983,1982,1981,1980,1979,1978,1977,1976,1975,1974,1973,1972,1971,1970,1969,1968,1967,1966,1965,1964,1963,1962,1961
This statistics in other country:
AfghanistanAlbaniaAlgeriaAngolaAntigua and BarbudaArab WorldArgentinaArmeniaArubaAustraliaAustriaAzerbaijanBahamas, TheBahrainBangladeshBarbadosBelarusBelgiumBelizeBeninBhutanBoliviaBosnia and HerzegovinaBotswanaBrazilBrunei DarussalamBulgariaBurkina FasoBurundiCabo VerdeCambodiaCameroonCanadaCaribbean small statesCentral African RepublicCentral Europe and the BalticsChadChannel IslandsChileChinaColombiaComorosCongo, Dem. Rep.Congo, Rep.Costa RicaCote d'IvoireCroatiaCubaCuracaoCyprusCzech RepublicDenmarkDjiboutiDominican RepublicEarly-demographic dividendEast Asia & PacificEast Asia & Pacific (excluding high income)East Asia & Pacific (IDA & IBRD countries)EcuadorEgypt, Arab Rep.El SalvadorEquatorial GuineaEritreaEstoniaEthiopiaEuro areaEurope & Central AsiaEurope & Central Asia (excluding high income)Europe & Central Asia (IDA & IBRD countries)European UnionFijiFinlandFragile and conflict affected situationsFranceFrench PolynesiaGabonGambia, TheGeorgiaGermanyGhanaGreeceGrenadaGuamGuatemalaGuineaGuinea-BissauGuyanaHaitiHeavily indebted poor countries (HIPC)High incomeHondurasHong Kong SAR, ChinaHungaryIBRD onlyIcelandIDA & IBRD totalIDA blendIDA onlyIDA totalIndiaIndonesiaIran, Islamic Rep.IraqIrelandIsraelItalyJamaicaJapanJordanKazakhstanKenyaKiribatiKorea, Dem. People’s Rep.Korea, Rep.KosovoKuwaitKyrgyz RepublicLao PDRLate-demographic dividendLatin America & Caribbean Latin America & Caribbean (excluding high income)Latin America & the Caribbean (IDA & IBRD countries)LatviaLeast developed countries: UN classificationLebanonLesothoLiberiaLibyaLithuaniaLow & middle incomeLow incomeLower middle incomeLuxembourgMacao SAR, ChinaMacedonia, FYRMadagascarMalawiMalaysiaMaldivesMaliMaltaMauritaniaMauritiusMexicoMicronesia, Fed. Sts.Middle East & North AfricaMiddle East & North Africa (excluding high income)Middle East & North Africa (IDA & IBRD countries)Middle incomeMoldovaMongoliaMontenegroMoroccoMozambiqueMyanmarNamibiaNepalNetherlandsNew CaledoniaNew ZealandNicaraguaNigerNigeriaNorth AmericaNorwayOECD membersOmanOther small statesPacific island small statesPakistanPanamaPapua New GuineaParaguayPeruPhilippinesPolandPortugalPost-demographic dividendPre-demographic dividendPuerto RicoQatarRomaniaRussian FederationRwandaSamoaSao Tome and PrincipeSaudi ArabiaSenegalSerbiaSeychellesSierra LeoneSingaporeSlovak RepublicSloveniaSmall statesSolomon IslandsSomaliaSouth AfricaSouth AsiaSouth Asia (IDA & IBRD)South SudanSpainSri LankaSt. LuciaSt. Vincent and the GrenadinesSub-Saharan Africa Sub-Saharan Africa (excluding high income)Sub-Saharan Africa (IDA & IBRD countries)SudanSurinameSwazilandSwedenSwitzerlandSyrian Arab RepublicTajikistanTanzaniaThailandTimor-LesteTogoTongaTrinidad and TobagoTunisiaTurkeyTurkmenistanUgandaUkraineUnited Arab EmiratesUnited KingdomUnited StatesUpper middle incomeUruguayUzbekistanVanuatuVenezuela, RBVietnamVirgin Islands (U.S.)West Bank and GazaWorldYemen, Rep.ZambiaZimbabwe Timeline:
This timeline shows a graph from 1961 to 2016 of Finland. No data until 1960. Number of actual observations by date: 56.
Source name:
World Development Indicators
Source organization:
World Bank staff estimates based on age distributions of United Nations Population Division's World Population Prospects.
Categories, topics:
Education, Health
Last updated:
apr 23, 2017
Indicators value changes by year
Minimum:
62.286
jan 1, 1961
Maximum:
68.126
jan 1, 1985
At the date of observation
Value
Absolute change
Change from previous value
jan 1, 1961
62.286
+62.286
0.0%
jan 1, 1962
62.51
+0.224
0.36%
jan 1, 1963
62.987
+0.476
0.76%
jan 1, 1964
63.628
+0.641
1.02%
jan 1, 1965
64.264
+0.636
1.0%
jan 1, 1966
64.805
+0.541
0.84%
jan 1, 1967
65.157
+0.352
0.54%
jan 1, 1968
65.467
+0.31
0.48%
jan 1, 1969
65.735
+0.268
0.41%
jan 1, 1970
65.984
+0.249
0.38%
jan 1, 1971
66.223
+0.239
0.36%
jan 1, 1972
66.475
+0.252
0.38%
jan 1, 1973
66.724
+0.249
0.37%
jan 1, 1974
66.963
+0.239
0.36%
jan 1, 1975
67.181
+0.218
0.33%
jan 1, 1976
67.373
+0.192
0.29%
jan 1, 1977
67.503
+0.13
0.19%
jan 1, 1978
67.543
+0.039
0.06%
jan 1, 1979
67.551
+0.008
0.01%
jan 1, 1980
67.601
+0.05
0.07%
jan 1, 1981
67.715
+0.114
0.17%
jan 1, 1982
67.72
+0.005
0.01%
jan 1, 1983
67.853
+0.133
0.2%
jan 1, 1984
68.026
+0.174
0.26%
jan 1, 1985
68.126
+0.1
0.15%
jan 1, 1986
68.105
-0.021
-0.03%
jan 1, 1987
68.053
-0.052
-0.08%
jan 1, 1988
67.899
-0.153
-0.23%
jan 1, 1989
67.686
-0.214
-0.31%
jan 1, 1990
67.474
-0.211
-0.31%
jan 1, 1991
67.295
-0.179
-0.27%
jan 1, 1992
67.149
-0.146
-0.22%
jan 1, 1993
66.99
-0.159
-0.24%
jan 1, 1994
66.849
-0.141
-0.21%
jan 1, 1995
66.764
-0.085
-0.13%
jan 1, 1996
66.753
-0.01
-0.02%
jan 1, 1997
66.66
-0.094
-0.14%
jan 1, 1998
66.696
+0.037
0.05%
jan 1, 1999
66.804
+0.108
0.16%
jan 1, 2000
66.896
+0.092
0.14%
jan 1, 2001
66.929
+0.033
0.05%
jan 1, 2002
66.979
+0.05
0.08%
jan 1, 2003
66.927
-0.052
-0.08%
jan 1, 2004
66.819
-0.108
-0.16%
jan 1, 2005
66.733
-0.086
-0.13%
jan 1, 2006
66.699
-0.034
-0.05%
jan 1, 2007
66.632
-0.067
-0.1%
jan 1, 2008
66.636
+0.005
0.01%
jan 1, 2009
66.662
+0.026
0.04%
jan 1, 2010
66.597
-0.065
-0.1%
jan 1, 2011
66.361
-0.237
-0.36%
jan 1, 2012
65.934
-0.426
-0.64%
jan 1, 2013
65.34
-0.595
-0.9%
jan 1, 2014
64.617
-0.723
-1.11%
jan 1, 2015
63.869
-0.748
-1.16%
jan 1, 2016
63.184
-0.684
-1.07%
Ranking of countries by current statistics by years


Comments: