29
/
en
AIzaSyAYiBZKx7MnpbEhh9jyipgxe19OcubqV5w
April 1, 2024
37695
IDA & IBRD total
IBT
false
2
1
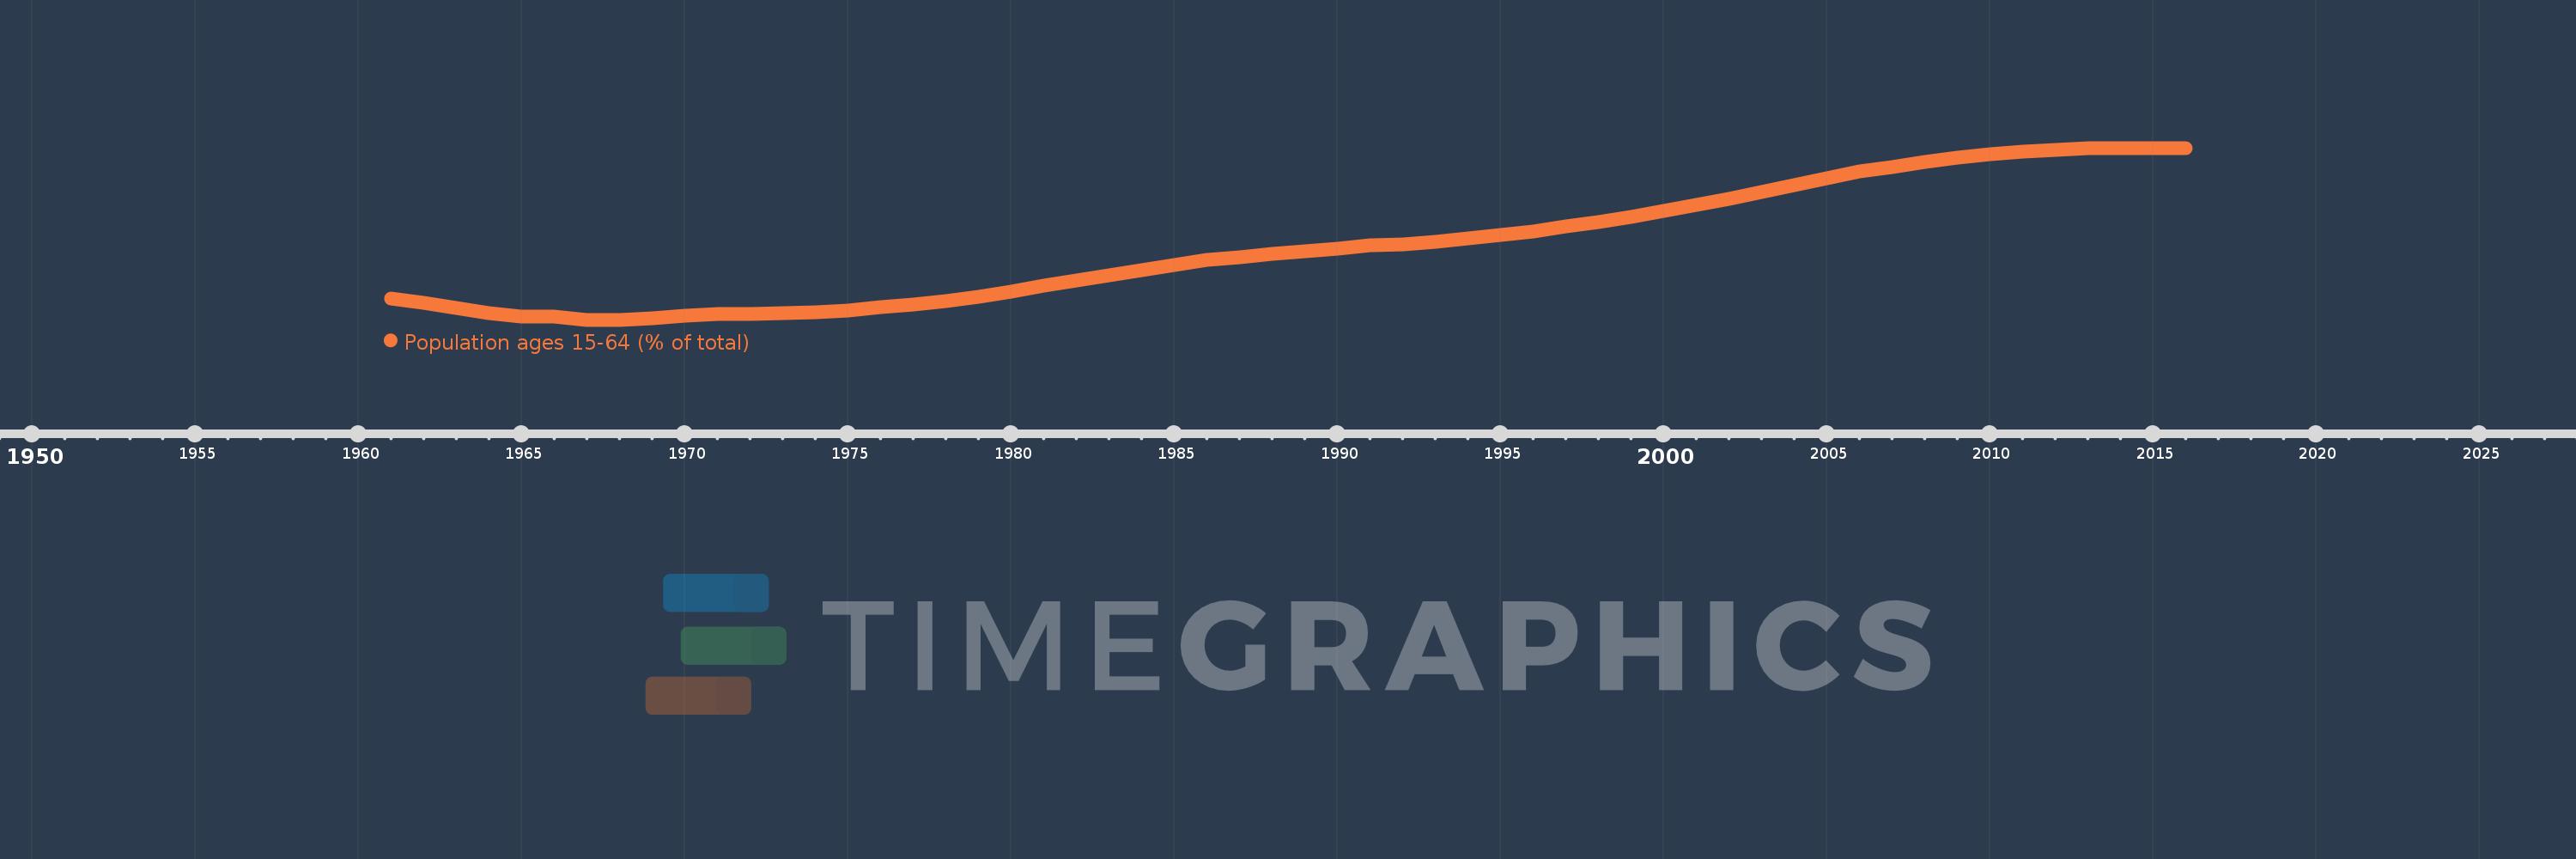
Population ages 15-64 (% of total)
2016,2015,2014,2013,2012,2011,2010,2009,2008,2007,2006,2005,2004,2003,2002,2001,2000,1999,1998,1997,1996,1995,1994,1993,1992,1991,1990,1989,1988,1987,1986,1985,1984,1983,1982,1981,1980,1979,1978,1977,1976,1975,1974,1973,1972,1971,1970,1969,1968,1967,1966,1965,1964,1963,1962,1961
This statistics in other country:
AfghanistanAlbaniaAlgeriaAngolaAntigua and BarbudaArab WorldArgentinaArmeniaArubaAustraliaAustriaAzerbaijanBahamas, TheBahrainBangladeshBarbadosBelarusBelgiumBelizeBeninBhutanBoliviaBosnia and HerzegovinaBotswanaBrazilBrunei DarussalamBulgariaBurkina FasoBurundiCabo VerdeCambodiaCameroonCanadaCaribbean small statesCentral African RepublicCentral Europe and the BalticsChadChannel IslandsChileChinaColombiaComorosCongo, Dem. Rep.Congo, Rep.Costa RicaCote d'IvoireCroatiaCubaCuracaoCyprusCzech RepublicDenmarkDjiboutiDominican RepublicEarly-demographic dividendEast Asia & PacificEast Asia & Pacific (excluding high income)East Asia & Pacific (IDA & IBRD countries)EcuadorEgypt, Arab Rep.El SalvadorEquatorial GuineaEritreaEstoniaEthiopiaEuro areaEurope & Central AsiaEurope & Central Asia (excluding high income)Europe & Central Asia (IDA & IBRD countries)European UnionFijiFinlandFragile and conflict affected situationsFranceFrench PolynesiaGabonGambia, TheGeorgiaGermanyGhanaGreeceGrenadaGuamGuatemalaGuineaGuinea-BissauGuyanaHaitiHeavily indebted poor countries (HIPC)High incomeHondurasHong Kong SAR, ChinaHungaryIBRD onlyIcelandIDA & IBRD totalIDA blendIDA onlyIDA totalIndiaIndonesiaIran, Islamic Rep.IraqIrelandIsraelItalyJamaicaJapanJordanKazakhstanKenyaKiribatiKorea, Dem. People’s Rep.Korea, Rep.KosovoKuwaitKyrgyz RepublicLao PDRLate-demographic dividendLatin America & Caribbean Latin America & Caribbean (excluding high income)Latin America & the Caribbean (IDA & IBRD countries)LatviaLeast developed countries: UN classificationLebanonLesothoLiberiaLibyaLithuaniaLow & middle incomeLow incomeLower middle incomeLuxembourgMacao SAR, ChinaMacedonia, FYRMadagascarMalawiMalaysiaMaldivesMaliMaltaMauritaniaMauritiusMexicoMicronesia, Fed. Sts.Middle East & North AfricaMiddle East & North Africa (excluding high income)Middle East & North Africa (IDA & IBRD countries)Middle incomeMoldovaMongoliaMontenegroMoroccoMozambiqueMyanmarNamibiaNepalNetherlandsNew CaledoniaNew ZealandNicaraguaNigerNigeriaNorth AmericaNorwayOECD membersOmanOther small statesPacific island small statesPakistanPanamaPapua New GuineaParaguayPeruPhilippinesPolandPortugalPost-demographic dividendPre-demographic dividendPuerto RicoQatarRomaniaRussian FederationRwandaSamoaSao Tome and PrincipeSaudi ArabiaSenegalSerbiaSeychellesSierra LeoneSingaporeSlovak RepublicSloveniaSmall statesSolomon IslandsSomaliaSouth AfricaSouth AsiaSouth Asia (IDA & IBRD)South SudanSpainSri LankaSt. LuciaSt. Vincent and the GrenadinesSub-Saharan Africa Sub-Saharan Africa (excluding high income)Sub-Saharan Africa (IDA & IBRD countries)SudanSurinameSwazilandSwedenSwitzerlandSyrian Arab RepublicTajikistanTanzaniaThailandTimor-LesteTogoTongaTrinidad and TobagoTunisiaTurkeyTurkmenistanUgandaUkraineUnited Arab EmiratesUnited KingdomUnited StatesUpper middle incomeUruguayUzbekistanVanuatuVenezuela, RBVietnamVirgin Islands (U.S.)West Bank and GazaWorldYemen, Rep.ZambiaZimbabwe Timeline:
This timeline shows a graph from 1961 to 2016 of IDA & IBRD total. No data until 1960. Number of actual observations by date: 56.
Source name:
World Development Indicators
Source organization:
World Bank staff estimates based on age distributions of United Nations Population Division's World Population Prospects.
Categories, topics:
Education, Health
Last updated:
apr 23, 2017
Indicators value changes by year
Minimum:
55.114
jan 1, 1968
Maximum:
65.579
jan 1, 2015
At the date of observation
Value
Absolute change
Change from previous value
jan 1, 1961
56.415
+56.415
0.0%
jan 1, 1962
56.139
-0.276
-0.49%
jan 1, 1963
55.813
-0.326
-0.58%
jan 1, 1964
55.512
-0.302
-0.54%
jan 1, 1965
55.328
-0.184
-0.33%
jan 1, 1966
55.293
-0.035
-0.06%
jan 1, 1967
55.116
-0.176
-0.32%
jan 1, 1968
55.114
-0.003
0.0%
jan 1, 1969
55.222
+0.108
0.2%
jan 1, 1970
55.355
+0.133
0.24%
jan 1, 1971
55.474
+0.119
0.22%
jan 1, 1972
55.468
-0.006
-0.01%
jan 1, 1973
55.498
+0.03
0.05%
jan 1, 1974
55.562
+0.064
0.12%
jan 1, 1975
55.68
+0.118
0.21%
jan 1, 1976
55.865
+0.185
0.33%
jan 1, 1977
56.016
+0.151
0.27%
jan 1, 1978
56.235
+0.219
0.39%
jan 1, 1979
56.513
+0.278
0.49%
jan 1, 1980
56.833
+0.32
0.57%
jan 1, 1981
57.179
+0.346
0.61%
jan 1, 1982
57.494
+0.315
0.55%
jan 1, 1983
57.813
+0.319
0.55%
jan 1, 1984
58.135
+0.322
0.56%
jan 1, 1985
58.457
+0.322
0.55%
jan 1, 1986
58.77
+0.313
0.54%
jan 1, 1987
58.93
+0.16
0.27%
jan 1, 1988
59.104
+0.173
0.29%
jan 1, 1989
59.281
+0.177
0.3%
jan 1, 1990
59.462
+0.181
0.31%
jan 1, 1991
59.655
+0.193
0.33%
jan 1, 1992
59.712
+0.057
0.1%
jan 1, 1993
59.853
+0.14
0.23%
jan 1, 1994
60.049
+0.196
0.33%
jan 1, 1995
60.27
+0.221
0.37%
jan 1, 1996
60.508
+0.238
0.39%
jan 1, 1997
60.807
+0.299
0.49%
jan 1, 1998
61.086
+0.279
0.46%
jan 1, 1999
61.377
+0.291
0.48%
jan 1, 2000
61.724
+0.347
0.56%
jan 1, 2001
62.129
+0.405
0.66%
jan 1, 2002
62.48
+0.351
0.56%
jan 1, 2003
62.879
+0.399
0.64%
jan 1, 2004
63.308
+0.429
0.68%
jan 1, 2005
63.733
+0.425
0.67%
jan 1, 2006
64.133
+0.399
0.63%
jan 1, 2007
64.429
+0.297
0.46%
jan 1, 2008
64.718
+0.289
0.45%
jan 1, 2009
64.98
+0.262
0.41%
jan 1, 2010
65.199
+0.219
0.34%
jan 1, 2011
65.37
+0.17
0.26%
jan 1, 2012
65.472
+0.103
0.16%
jan 1, 2013
65.538
+0.065
0.1%
jan 1, 2014
65.571
+0.033
0.05%
jan 1, 2015
65.579
+0.008
0.01%
jan 1, 2016
65.57
-0.009
-0.01%
Ranking of countries by current statistics by years


Comments: