29
/
en
AIzaSyAYiBZKx7MnpbEhh9jyipgxe19OcubqV5w
April 1, 2024
246106
South Africa
ZAF
true
2
1
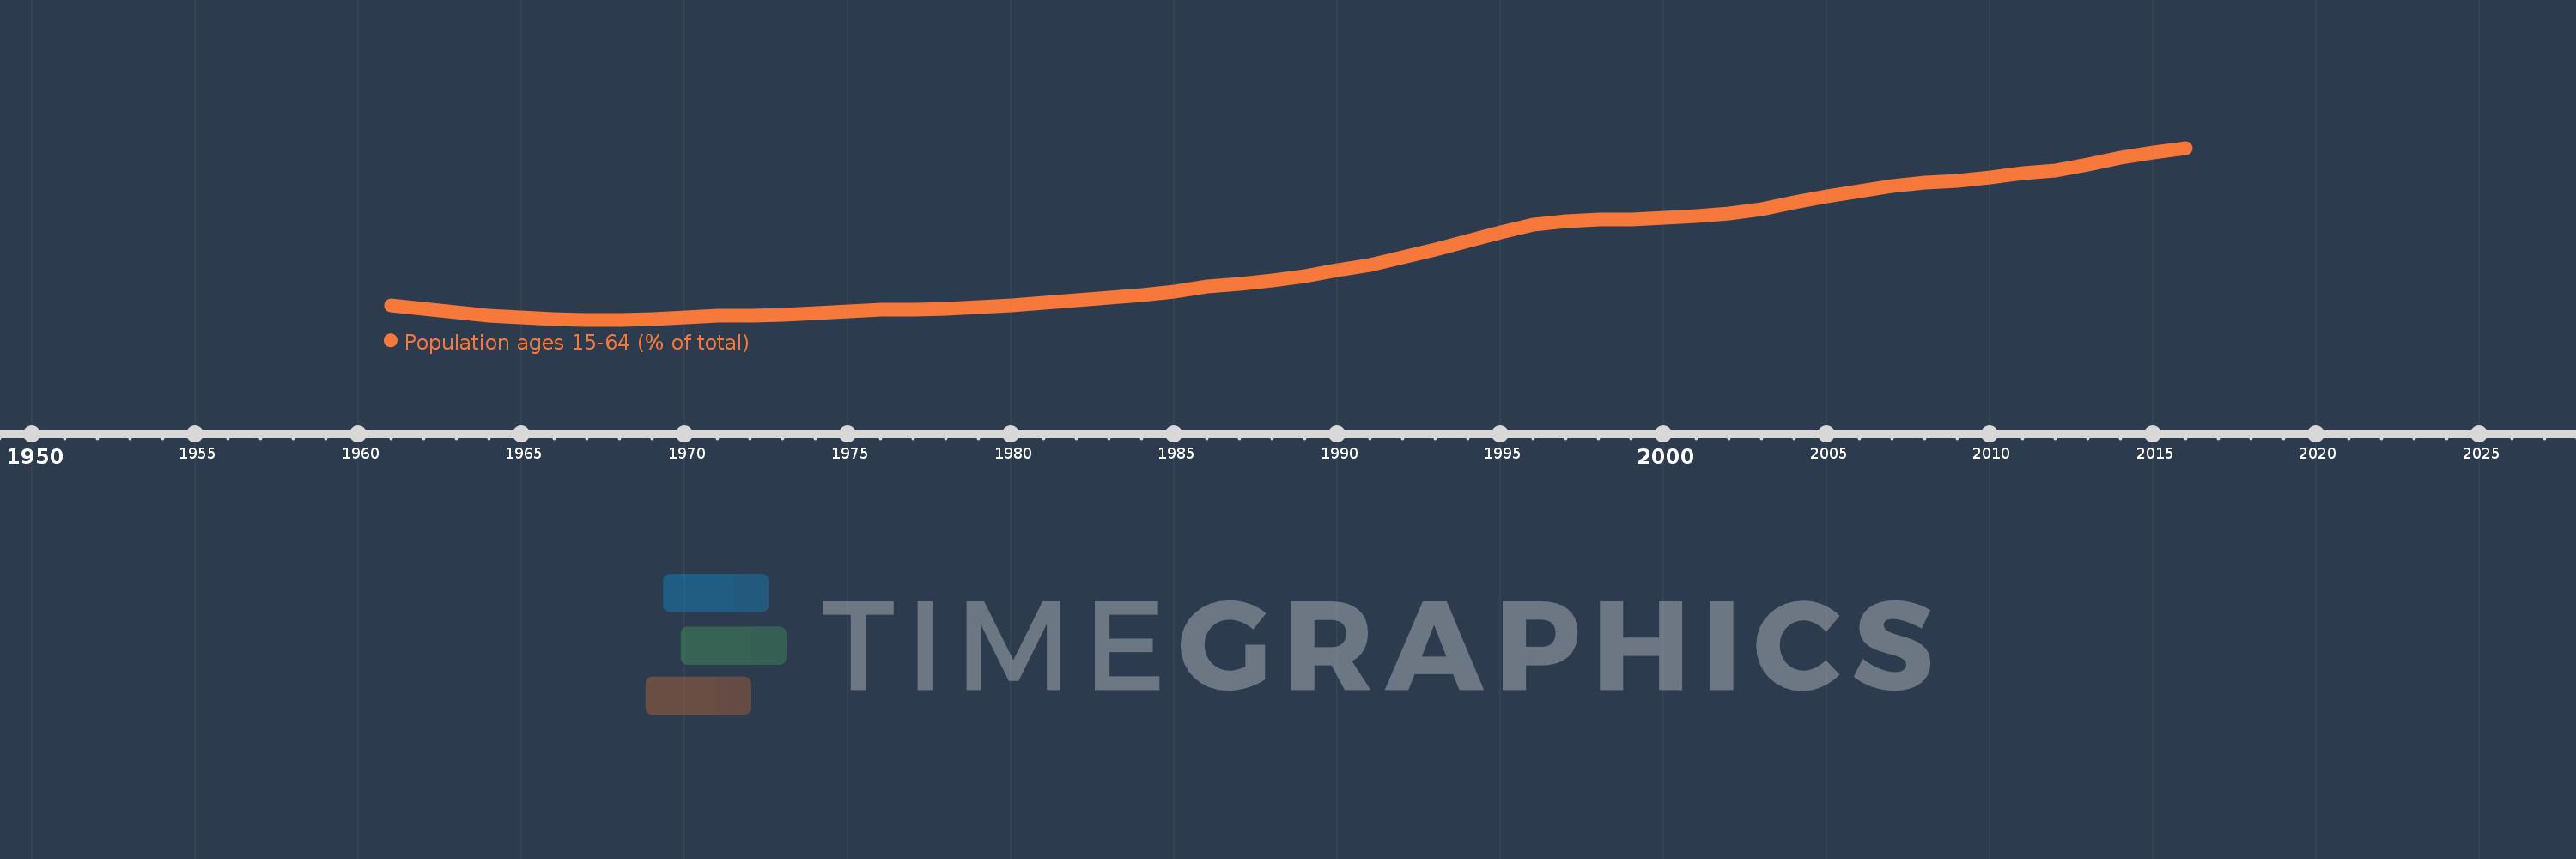
Population ages 15-64 (% of total)
2016,2015,2014,2013,2012,2011,2010,2009,2008,2007,2006,2005,2004,2003,2002,2001,2000,1999,1998,1997,1996,1995,1994,1993,1992,1991,1990,1989,1988,1987,1986,1985,1984,1983,1982,1981,1980,1979,1978,1977,1976,1975,1974,1973,1972,1971,1970,1969,1968,1967,1966,1965,1964,1963,1962,1961
This statistics in other country:
AfghanistanAlbaniaAlgeriaAngolaAntigua and BarbudaArab WorldArgentinaArmeniaArubaAustraliaAustriaAzerbaijanBahamas, TheBahrainBangladeshBarbadosBelarusBelgiumBelizeBeninBhutanBoliviaBosnia and HerzegovinaBotswanaBrazilBrunei DarussalamBulgariaBurkina FasoBurundiCabo VerdeCambodiaCameroonCanadaCaribbean small statesCentral African RepublicCentral Europe and the BalticsChadChannel IslandsChileChinaColombiaComorosCongo, Dem. Rep.Congo, Rep.Costa RicaCote d'IvoireCroatiaCubaCuracaoCyprusCzech RepublicDenmarkDjiboutiDominican RepublicEarly-demographic dividendEast Asia & PacificEast Asia & Pacific (excluding high income)East Asia & Pacific (IDA & IBRD countries)EcuadorEgypt, Arab Rep.El SalvadorEquatorial GuineaEritreaEstoniaEthiopiaEuro areaEurope & Central AsiaEurope & Central Asia (excluding high income)Europe & Central Asia (IDA & IBRD countries)European UnionFijiFinlandFragile and conflict affected situationsFranceFrench PolynesiaGabonGambia, TheGeorgiaGermanyGhanaGreeceGrenadaGuamGuatemalaGuineaGuinea-BissauGuyanaHaitiHeavily indebted poor countries (HIPC)High incomeHondurasHong Kong SAR, ChinaHungaryIBRD onlyIcelandIDA & IBRD totalIDA blendIDA onlyIDA totalIndiaIndonesiaIran, Islamic Rep.IraqIrelandIsraelItalyJamaicaJapanJordanKazakhstanKenyaKiribatiKorea, Dem. People’s Rep.Korea, Rep.KosovoKuwaitKyrgyz RepublicLao PDRLate-demographic dividendLatin America & Caribbean Latin America & Caribbean (excluding high income)Latin America & the Caribbean (IDA & IBRD countries)LatviaLeast developed countries: UN classificationLebanonLesothoLiberiaLibyaLithuaniaLow & middle incomeLow incomeLower middle incomeLuxembourgMacao SAR, ChinaMacedonia, FYRMadagascarMalawiMalaysiaMaldivesMaliMaltaMauritaniaMauritiusMexicoMicronesia, Fed. Sts.Middle East & North AfricaMiddle East & North Africa (excluding high income)Middle East & North Africa (IDA & IBRD countries)Middle incomeMoldovaMongoliaMontenegroMoroccoMozambiqueMyanmarNamibiaNepalNetherlandsNew CaledoniaNew ZealandNicaraguaNigerNigeriaNorth AmericaNorwayOECD membersOmanOther small statesPacific island small statesPakistanPanamaPapua New GuineaParaguayPeruPhilippinesPolandPortugalPost-demographic dividendPre-demographic dividendPuerto RicoQatarRomaniaRussian FederationRwandaSamoaSao Tome and PrincipeSaudi ArabiaSenegalSerbiaSeychellesSierra LeoneSingaporeSlovak RepublicSloveniaSmall statesSolomon IslandsSomaliaSouth AfricaSouth AsiaSouth Asia (IDA & IBRD)South SudanSpainSri LankaSt. LuciaSt. Vincent and the GrenadinesSub-Saharan Africa Sub-Saharan Africa (excluding high income)Sub-Saharan Africa (IDA & IBRD countries)SudanSurinameSwazilandSwedenSwitzerlandSyrian Arab RepublicTajikistanTanzaniaThailandTimor-LesteTogoTongaTrinidad and TobagoTunisiaTurkeyTurkmenistanUgandaUkraineUnited Arab EmiratesUnited KingdomUnited StatesUpper middle incomeUruguayUzbekistanVanuatuVenezuela, RBVietnamVirgin Islands (U.S.)West Bank and GazaWorldYemen, Rep.ZambiaZimbabwe Timeline:
This timeline shows a graph from 1961 to 2016 of South Africa. No data until 1960. Number of actual observations by date: 56.
Source name:
World Development Indicators
Source organization:
World Bank staff estimates based on age distributions of United Nations Population Division's World Population Prospects.
Categories, topics:
Education, Health
Last updated:
apr 23, 2017
Indicators value changes by year
Minimum:
54.203
jan 1, 1967
Maximum:
65.727
jan 1, 2016
At the date of observation
Value
Absolute change
Change from previous value
jan 1, 1961
55.192
+55.192
0.0%
jan 1, 1962
54.914
-0.278
-0.5%
jan 1, 1963
54.681
-0.233
-0.42%
jan 1, 1964
54.487
-0.194
-0.36%
jan 1, 1965
54.342
-0.145
-0.27%
jan 1, 1966
54.256
-0.086
-0.16%
jan 1, 1967
54.203
-0.053
-0.1%
jan 1, 1968
54.206
+0.002
0.0%
jan 1, 1969
54.259
+0.053
0.1%
jan 1, 1970
54.356
+0.097
0.18%
jan 1, 1971
54.487
+0.132
0.24%
jan 1, 1972
54.475
-0.012
-0.02%
jan 1, 1973
54.526
+0.051
0.09%
jan 1, 1974
54.622
+0.096
0.18%
jan 1, 1975
54.748
+0.126
0.23%
jan 1, 1976
54.898
+0.151
0.28%
jan 1, 1977
54.904
+0.005
0.01%
jan 1, 1978
54.961
+0.057
0.1%
jan 1, 1979
55.06
+0.099
0.18%
jan 1, 1980
55.191
+0.132
0.24%
jan 1, 1981
55.35
+0.158
0.29%
jan 1, 1982
55.497
+0.147
0.27%
jan 1, 1983
55.659
+0.162
0.29%
jan 1, 1984
55.852
+0.193
0.35%
jan 1, 1985
56.098
+0.246
0.44%
jan 1, 1986
56.405
+0.307
0.55%
jan 1, 1987
56.585
+0.179
0.32%
jan 1, 1988
56.841
+0.256
0.45%
jan 1, 1989
57.153
+0.313
0.55%
jan 1, 1990
57.5
+0.347
0.61%
jan 1, 1991
57.871
+0.372
0.65%
jan 1, 1992
58.377
+0.505
0.87%
jan 1, 1993
58.922
+0.545
0.93%
jan 1, 1994
59.49
+0.569
0.97%
jan 1, 1995
60.058
+0.567
0.95%
jan 1, 1996
60.599
+0.542
0.9%
jan 1, 1997
60.798
+0.199
0.33%
jan 1, 1998
60.901
+0.103
0.17%
jan 1, 1999
60.951
+0.051
0.08%
jan 1, 2000
61.019
+0.068
0.11%
jan 1, 2001
61.153
+0.134
0.22%
jan 1, 2002
61.308
+0.156
0.25%
jan 1, 2003
61.63
+0.322
0.52%
jan 1, 2004
62.058
+0.427
0.69%
jan 1, 2005
62.487
+0.43
0.69%
jan 1, 2006
62.857
+0.37
0.59%
jan 1, 2007
63.191
+0.334
0.53%
jan 1, 2008
63.397
+0.206
0.33%
jan 1, 2009
63.537
+0.14
0.22%
jan 1, 2010
63.724
+0.187
0.29%
jan 1, 2011
64.01
+0.286
0.45%
jan 1, 2012
64.223
+0.213
0.33%
jan 1, 2013
64.599
+0.376
0.59%
jan 1, 2014
65.05
+0.451
0.7%
jan 1, 2015
65.446
+0.396
0.61%
jan 1, 2016
65.727
+0.282
0.43%
Ranking of countries by current statistics by years


Comments: