29
/
en
AIzaSyAYiBZKx7MnpbEhh9jyipgxe19OcubqV5w
April 1, 2024
53725
Other small states
OSS
false
2
1
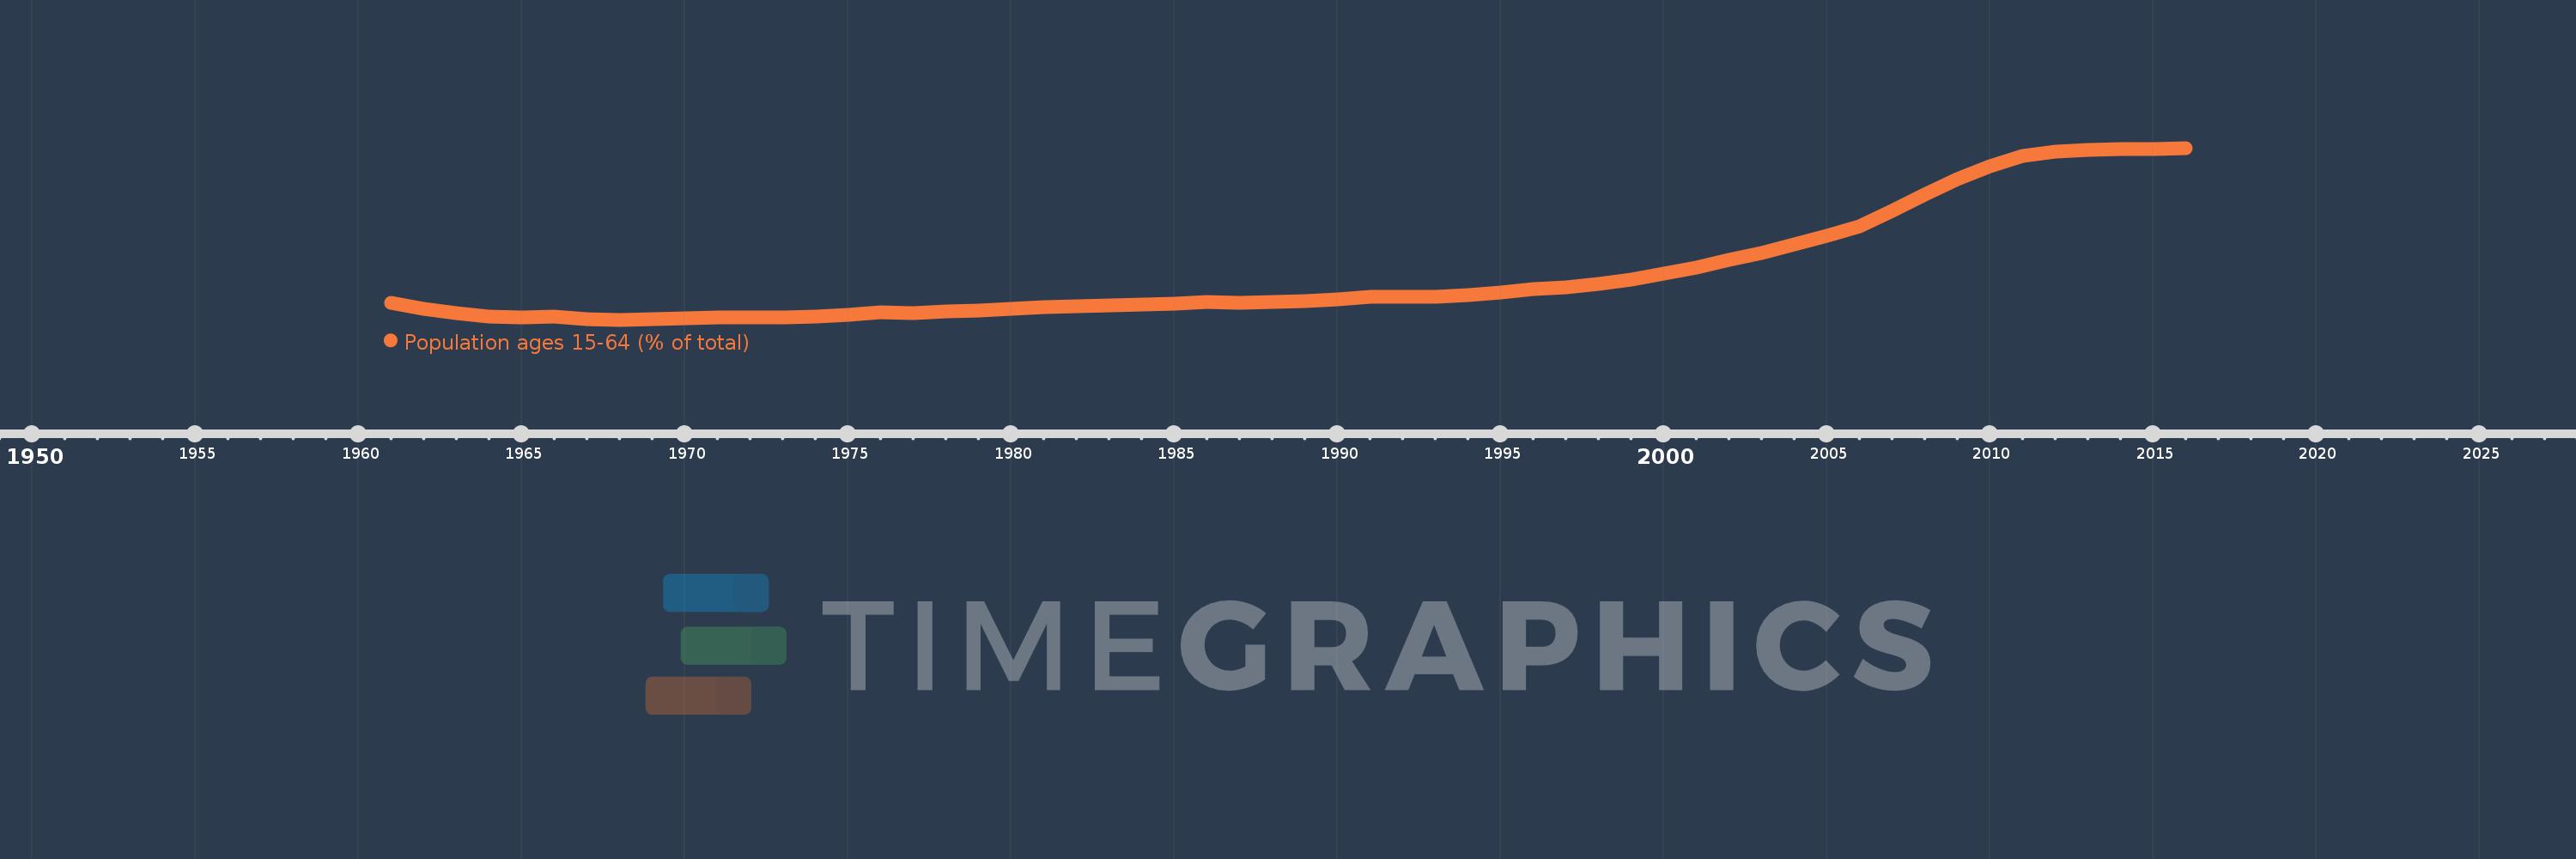
Population ages 15-64 (% of total)
2016,2015,2014,2013,2012,2011,2010,2009,2008,2007,2006,2005,2004,2003,2002,2001,2000,1999,1998,1997,1996,1995,1994,1993,1992,1991,1990,1989,1988,1987,1986,1985,1984,1983,1982,1981,1980,1979,1978,1977,1976,1975,1974,1973,1972,1971,1970,1969,1968,1967,1966,1965,1964,1963,1962,1961
This statistics in other country:
AfghanistanAlbaniaAlgeriaAngolaAntigua and BarbudaArab WorldArgentinaArmeniaArubaAustraliaAustriaAzerbaijanBahamas, TheBahrainBangladeshBarbadosBelarusBelgiumBelizeBeninBhutanBoliviaBosnia and HerzegovinaBotswanaBrazilBrunei DarussalamBulgariaBurkina FasoBurundiCabo VerdeCambodiaCameroonCanadaCaribbean small statesCentral African RepublicCentral Europe and the BalticsChadChannel IslandsChileChinaColombiaComorosCongo, Dem. Rep.Congo, Rep.Costa RicaCote d'IvoireCroatiaCubaCuracaoCyprusCzech RepublicDenmarkDjiboutiDominican RepublicEarly-demographic dividendEast Asia & PacificEast Asia & Pacific (excluding high income)East Asia & Pacific (IDA & IBRD countries)EcuadorEgypt, Arab Rep.El SalvadorEquatorial GuineaEritreaEstoniaEthiopiaEuro areaEurope & Central AsiaEurope & Central Asia (excluding high income)Europe & Central Asia (IDA & IBRD countries)European UnionFijiFinlandFragile and conflict affected situationsFranceFrench PolynesiaGabonGambia, TheGeorgiaGermanyGhanaGreeceGrenadaGuamGuatemalaGuineaGuinea-BissauGuyanaHaitiHeavily indebted poor countries (HIPC)High incomeHondurasHong Kong SAR, ChinaHungaryIBRD onlyIcelandIDA & IBRD totalIDA blendIDA onlyIDA totalIndiaIndonesiaIran, Islamic Rep.IraqIrelandIsraelItalyJamaicaJapanJordanKazakhstanKenyaKiribatiKorea, Dem. People’s Rep.Korea, Rep.KosovoKuwaitKyrgyz RepublicLao PDRLate-demographic dividendLatin America & Caribbean Latin America & Caribbean (excluding high income)Latin America & the Caribbean (IDA & IBRD countries)LatviaLeast developed countries: UN classificationLebanonLesothoLiberiaLibyaLithuaniaLow & middle incomeLow incomeLower middle incomeLuxembourgMacao SAR, ChinaMacedonia, FYRMadagascarMalawiMalaysiaMaldivesMaliMaltaMauritaniaMauritiusMexicoMicronesia, Fed. Sts.Middle East & North AfricaMiddle East & North Africa (excluding high income)Middle East & North Africa (IDA & IBRD countries)Middle incomeMoldovaMongoliaMontenegroMoroccoMozambiqueMyanmarNamibiaNepalNetherlandsNew CaledoniaNew ZealandNicaraguaNigerNigeriaNorth AmericaNorwayOECD membersOmanOther small statesPacific island small statesPakistanPanamaPapua New GuineaParaguayPeruPhilippinesPolandPortugalPost-demographic dividendPre-demographic dividendPuerto RicoQatarRomaniaRussian FederationRwandaSamoaSao Tome and PrincipeSaudi ArabiaSenegalSerbiaSeychellesSierra LeoneSingaporeSlovak RepublicSloveniaSmall statesSolomon IslandsSomaliaSouth AfricaSouth AsiaSouth Asia (IDA & IBRD)South SudanSpainSri LankaSt. LuciaSt. Vincent and the GrenadinesSub-Saharan Africa Sub-Saharan Africa (excluding high income)Sub-Saharan Africa (IDA & IBRD countries)SudanSurinameSwazilandSwedenSwitzerlandSyrian Arab RepublicTajikistanTanzaniaThailandTimor-LesteTogoTongaTrinidad and TobagoTunisiaTurkeyTurkmenistanUgandaUkraineUnited Arab EmiratesUnited KingdomUnited StatesUpper middle incomeUruguayUzbekistanVanuatuVenezuela, RBVietnamVirgin Islands (U.S.)West Bank and GazaWorldYemen, Rep.ZambiaZimbabwe Timeline:
This timeline shows a graph from 1961 to 2016 of Other small states. No data until 1960. Number of actual observations by date: 56.
Source name:
World Development Indicators
Source organization:
World Bank staff estimates based on age distributions of United Nations Population Division's World Population Prospects.
Categories, topics:
Education, Health
Last updated:
apr 23, 2017
Indicators value changes by year
Minimum:
55.981
jan 1, 1968
Maximum:
63.589
jan 1, 2016
At the date of observation
Value
Absolute change
Change from previous value
jan 1, 1961
56.736
+56.736
0.0%
jan 1, 1962
56.456
-0.281
-0.49%
jan 1, 1963
56.255
-0.201
-0.36%
jan 1, 1964
56.136
-0.12
-0.21%
jan 1, 1965
56.096
-0.04
-0.07%
jan 1, 1966
56.124
+0.028
0.05%
jan 1, 1967
56.014
-0.111
-0.2%
jan 1, 1968
55.981
-0.033
-0.06%
jan 1, 1969
56.0
+0.02
0.03%
jan 1, 1970
56.038
+0.038
0.07%
jan 1, 1971
56.079
+0.041
0.07%
jan 1, 1972
56.08
+0.001
0.0%
jan 1, 1973
56.099
+0.019
0.03%
jan 1, 1974
56.136
+0.036
0.06%
jan 1, 1975
56.203
+0.067
0.12%
jan 1, 1976
56.306
+0.103
0.18%
jan 1, 1977
56.291
-0.016
-0.03%
jan 1, 1978
56.332
+0.041
0.07%
jan 1, 1979
56.401
+0.069
0.12%
jan 1, 1980
56.473
+0.072
0.13%
jan 1, 1981
56.542
+0.069
0.12%
jan 1, 1982
56.572
+0.03
0.05%
jan 1, 1983
56.615
+0.043
0.08%
jan 1, 1984
56.66
+0.045
0.08%
jan 1, 1985
56.707
+0.048
0.08%
jan 1, 1986
56.761
+0.054
0.1%
jan 1, 1987
56.735
-0.026
-0.05%
jan 1, 1988
56.757
+0.022
0.04%
jan 1, 1989
56.808
+0.051
0.09%
jan 1, 1990
56.88
+0.072
0.13%
jan 1, 1991
56.983
+0.103
0.18%
jan 1, 1992
56.981
-0.002
0.0%
jan 1, 1993
57.008
+0.027
0.05%
jan 1, 1994
57.069
+0.062
0.11%
jan 1, 1995
57.188
+0.119
0.21%
jan 1, 1996
57.355
+0.167
0.29%
jan 1, 1997
57.414
+0.059
0.1%
jan 1, 1998
57.558
+0.143
0.25%
jan 1, 1999
57.76
+0.202
0.35%
jan 1, 2000
58.008
+0.248
0.43%
jan 1, 2001
58.296
+0.288
0.5%
jan 1, 2002
58.616
+0.321
0.55%
jan 1, 2003
58.951
+0.334
0.57%
jan 1, 2004
59.303
+0.352
0.6%
jan 1, 2005
59.691
+0.388
0.65%
jan 1, 2006
60.13
+0.44
0.74%
jan 1, 2007
60.812
+0.682
1.13%
jan 1, 2008
61.519
+0.706
1.16%
jan 1, 2009
62.198
+0.68
1.1%
jan 1, 2010
62.788
+0.589
0.95%
jan 1, 2011
63.254
+0.466
0.74%
jan 1, 2012
63.409
+0.155
0.24%
jan 1, 2013
63.502
+0.093
0.15%
jan 1, 2014
63.538
+0.036
0.06%
jan 1, 2015
63.556
+0.018
0.03%
jan 1, 2016
63.589
+0.033
0.05%
Ranking of countries by current statistics by years


Comments: