29
/
en
AIzaSyAYiBZKx7MnpbEhh9jyipgxe19OcubqV5w
April 1, 2024
114078
Cote d'Ivoire
CIV
true
2
1
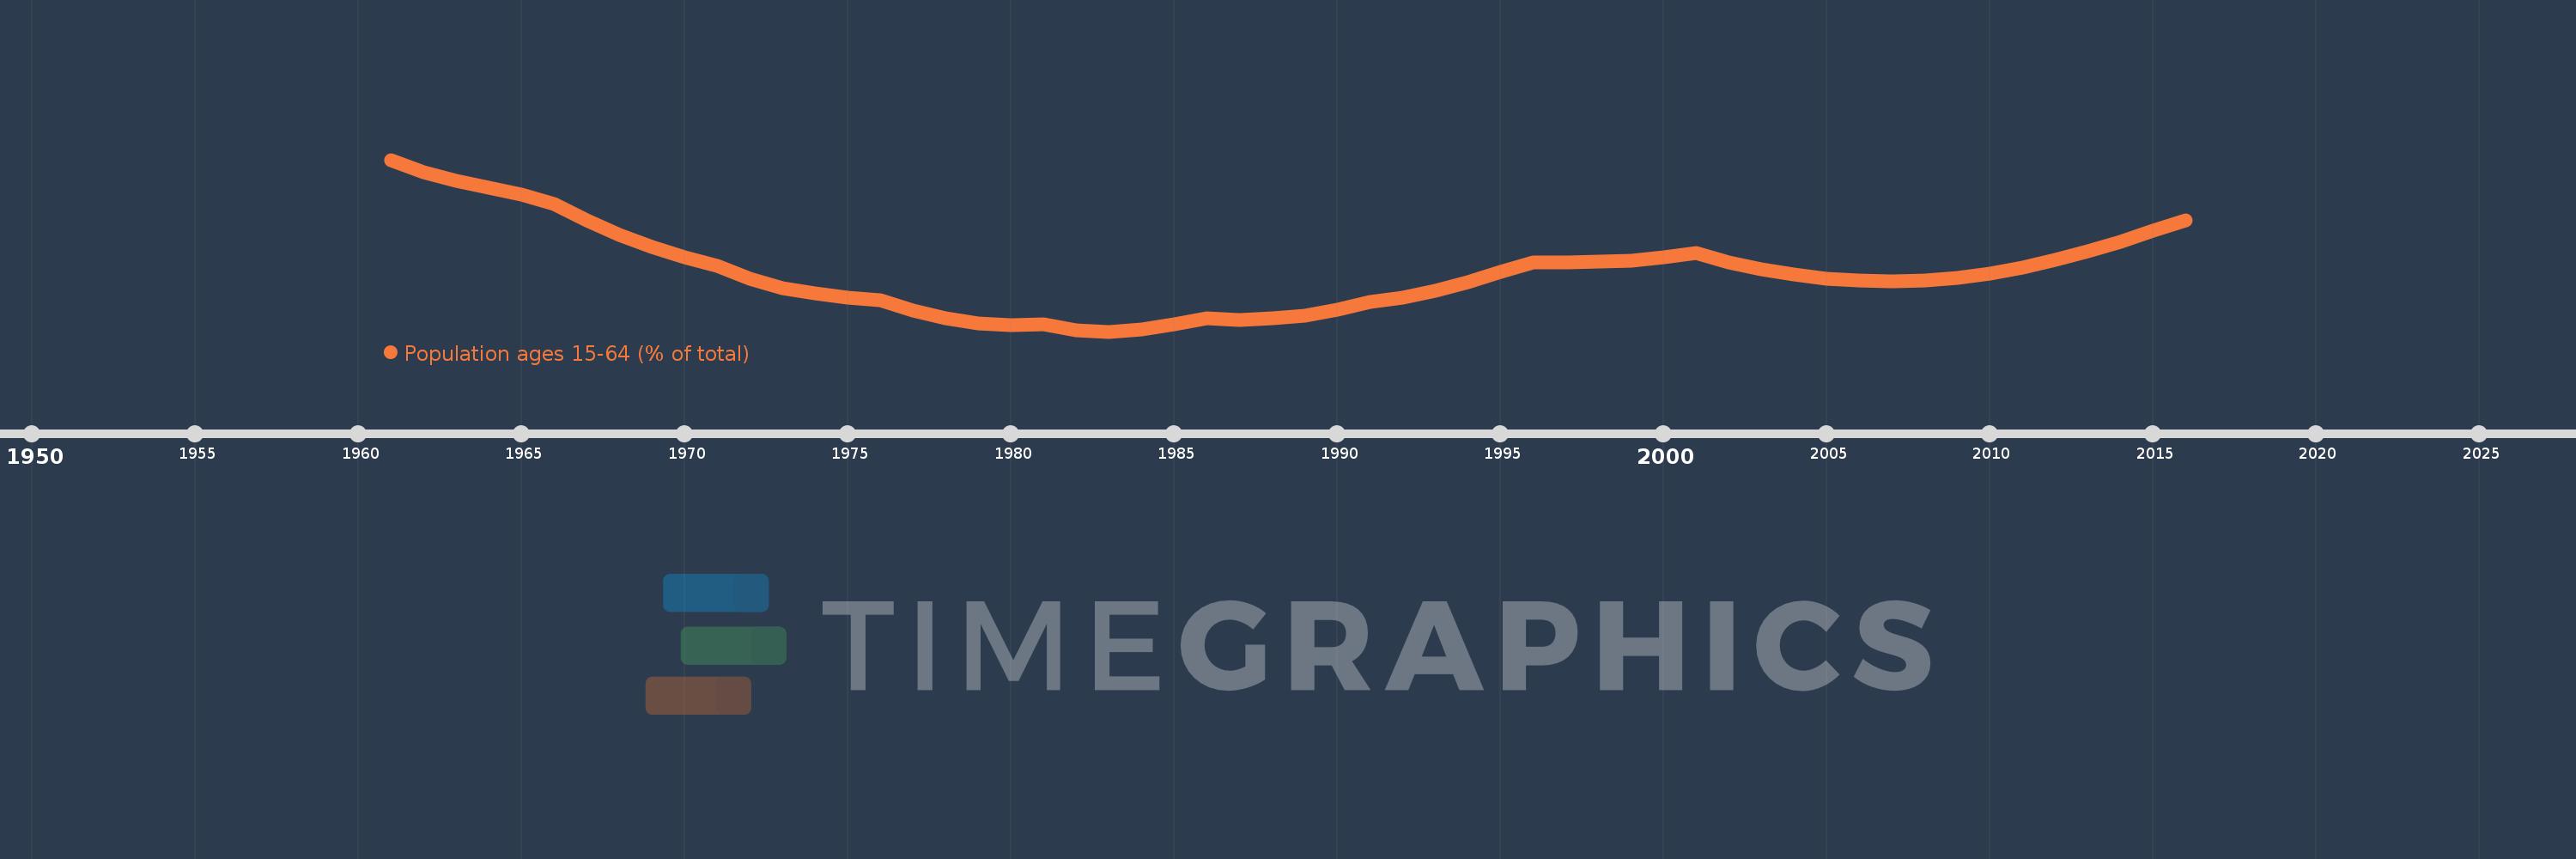
Population ages 15-64 (% of total)
2016,2015,2014,2013,2012,2011,2010,2009,2008,2007,2006,2005,2004,2003,2002,2001,2000,1999,1998,1997,1996,1995,1994,1993,1992,1991,1990,1989,1988,1987,1986,1985,1984,1983,1982,1981,1980,1979,1978,1977,1976,1975,1974,1973,1972,1971,1970,1969,1968,1967,1966,1965,1964,1963,1962,1961
This statistics in other country:
AfghanistanAlbaniaAlgeriaAngolaAntigua and BarbudaArab WorldArgentinaArmeniaArubaAustraliaAustriaAzerbaijanBahamas, TheBahrainBangladeshBarbadosBelarusBelgiumBelizeBeninBhutanBoliviaBosnia and HerzegovinaBotswanaBrazilBrunei DarussalamBulgariaBurkina FasoBurundiCabo VerdeCambodiaCameroonCanadaCaribbean small statesCentral African RepublicCentral Europe and the BalticsChadChannel IslandsChileChinaColombiaComorosCongo, Dem. Rep.Congo, Rep.Costa RicaCote d'IvoireCroatiaCubaCuracaoCyprusCzech RepublicDenmarkDjiboutiDominican RepublicEarly-demographic dividendEast Asia & PacificEast Asia & Pacific (excluding high income)East Asia & Pacific (IDA & IBRD countries)EcuadorEgypt, Arab Rep.El SalvadorEquatorial GuineaEritreaEstoniaEthiopiaEuro areaEurope & Central AsiaEurope & Central Asia (excluding high income)Europe & Central Asia (IDA & IBRD countries)European UnionFijiFinlandFragile and conflict affected situationsFranceFrench PolynesiaGabonGambia, TheGeorgiaGermanyGhanaGreeceGrenadaGuamGuatemalaGuineaGuinea-BissauGuyanaHaitiHeavily indebted poor countries (HIPC)High incomeHondurasHong Kong SAR, ChinaHungaryIBRD onlyIcelandIDA & IBRD totalIDA blendIDA onlyIDA totalIndiaIndonesiaIran, Islamic Rep.IraqIrelandIsraelItalyJamaicaJapanJordanKazakhstanKenyaKiribatiKorea, Dem. People’s Rep.Korea, Rep.KosovoKuwaitKyrgyz RepublicLao PDRLate-demographic dividendLatin America & Caribbean Latin America & Caribbean (excluding high income)Latin America & the Caribbean (IDA & IBRD countries)LatviaLeast developed countries: UN classificationLebanonLesothoLiberiaLibyaLithuaniaLow & middle incomeLow incomeLower middle incomeLuxembourgMacao SAR, ChinaMacedonia, FYRMadagascarMalawiMalaysiaMaldivesMaliMaltaMauritaniaMauritiusMexicoMicronesia, Fed. Sts.Middle East & North AfricaMiddle East & North Africa (excluding high income)Middle East & North Africa (IDA & IBRD countries)Middle incomeMoldovaMongoliaMontenegroMoroccoMozambiqueMyanmarNamibiaNepalNetherlandsNew CaledoniaNew ZealandNicaraguaNigerNigeriaNorth AmericaNorwayOECD membersOmanOther small statesPacific island small statesPakistanPanamaPapua New GuineaParaguayPeruPhilippinesPolandPortugalPost-demographic dividendPre-demographic dividendPuerto RicoQatarRomaniaRussian FederationRwandaSamoaSao Tome and PrincipeSaudi ArabiaSenegalSerbiaSeychellesSierra LeoneSingaporeSlovak RepublicSloveniaSmall statesSolomon IslandsSomaliaSouth AfricaSouth AsiaSouth Asia (IDA & IBRD)South SudanSpainSri LankaSt. LuciaSt. Vincent and the GrenadinesSub-Saharan Africa Sub-Saharan Africa (excluding high income)Sub-Saharan Africa (IDA & IBRD countries)SudanSurinameSwazilandSwedenSwitzerlandSyrian Arab RepublicTajikistanTanzaniaThailandTimor-LesteTogoTongaTrinidad and TobagoTunisiaTurkeyTurkmenistanUgandaUkraineUnited Arab EmiratesUnited KingdomUnited StatesUpper middle incomeUruguayUzbekistanVanuatuVenezuela, RBVietnamVirgin Islands (U.S.)West Bank and GazaWorldYemen, Rep.ZambiaZimbabwe Timeline:
This timeline shows a graph from 1961 to 2016 of Cote d'Ivoire. No data until 1960. Number of actual observations by date: 56.
Source name:
World Development Indicators
Source organization:
World Bank staff estimates based on age distributions of United Nations Population Division's World Population Prospects.
Categories, topics:
Education, Health
Last updated:
apr 23, 2017
Indicators value changes by year
Minimum:
51.835
jan 1, 1983
Maximum:
55.941
jan 1, 1961
At the date of observation
Value
Absolute change
Change from previous value
jan 1, 1961
55.941
+55.941
0.0%
jan 1, 1962
55.639
-0.302
-0.54%
jan 1, 1963
55.439
-0.2
-0.36%
jan 1, 1964
55.279
-0.16
-0.29%
jan 1, 1965
55.103
-0.177
-0.32%
jan 1, 1966
54.884
-0.219
-0.4%
jan 1, 1967
54.492
-0.392
-0.71%
jan 1, 1968
54.154
-0.338
-0.62%
jan 1, 1969
53.861
-0.293
-0.54%
jan 1, 1970
53.616
-0.245
-0.46%
jan 1, 1971
53.413
-0.203
-0.38%
jan 1, 1972
53.091
-0.322
-0.6%
jan 1, 1973
52.876
-0.215
-0.4%
jan 1, 1974
52.739
-0.137
-0.26%
jan 1, 1975
52.651
-0.088
-0.17%
jan 1, 1976
52.59
-0.061
-0.12%
jan 1, 1977
52.328
-0.261
-0.5%
jan 1, 1978
52.149
-0.179
-0.34%
jan 1, 1979
52.04
-0.109
-0.21%
jan 1, 1980
51.999
-0.041
-0.08%
jan 1, 1981
52.019
+0.019
0.04%
jan 1, 1982
51.867
-0.152
-0.29%
jan 1, 1983
51.835
-0.032
-0.06%
jan 1, 1984
51.891
+0.056
0.11%
jan 1, 1985
52.002
+0.111
0.21%
jan 1, 1986
52.149
+0.147
0.28%
jan 1, 1987
52.122
-0.027
-0.05%
jan 1, 1988
52.145
+0.024
0.05%
jan 1, 1989
52.222
+0.077
0.15%
jan 1, 1990
52.358
+0.136
0.26%
jan 1, 1991
52.545
+0.188
0.36%
jan 1, 1992
52.642
+0.097
0.18%
jan 1, 1993
52.809
+0.167
0.32%
jan 1, 1994
53.025
+0.215
0.41%
jan 1, 1995
53.26
+0.236
0.44%
jan 1, 1996
53.497
+0.236
0.44%
jan 1, 1997
53.487
-0.009
-0.02%
jan 1, 1998
53.498
+0.011
0.02%
jan 1, 1999
53.534
+0.036
0.07%
jan 1, 2000
53.606
+0.072
0.14%
jan 1, 2001
53.719
+0.113
0.21%
jan 1, 2002
53.488
-0.231
-0.43%
jan 1, 2003
53.314
-0.174
-0.33%
jan 1, 2004
53.192
-0.123
-0.23%
jan 1, 2005
53.107
-0.085
-0.16%
jan 1, 2006
53.051
-0.055
-0.1%
jan 1, 2007
53.041
-0.011
-0.02%
jan 1, 2008
53.064
+0.023
0.04%
jan 1, 2009
53.126
+0.062
0.12%
jan 1, 2010
53.23
+0.104
0.2%
jan 1, 2011
53.368
+0.138
0.26%
jan 1, 2012
53.55
+0.181
0.34%
jan 1, 2013
53.758
+0.208
0.39%
jan 1, 2014
53.99
+0.232
0.43%
jan 1, 2015
54.24
+0.25
0.46%
jan 1, 2016
54.499
+0.259
0.48%
Ranking of countries by current statistics by years


Comments: