29
/
en
AIzaSyAYiBZKx7MnpbEhh9jyipgxe19OcubqV5w
April 1, 2024
104458
Channel Islands
CHI
true
2
1
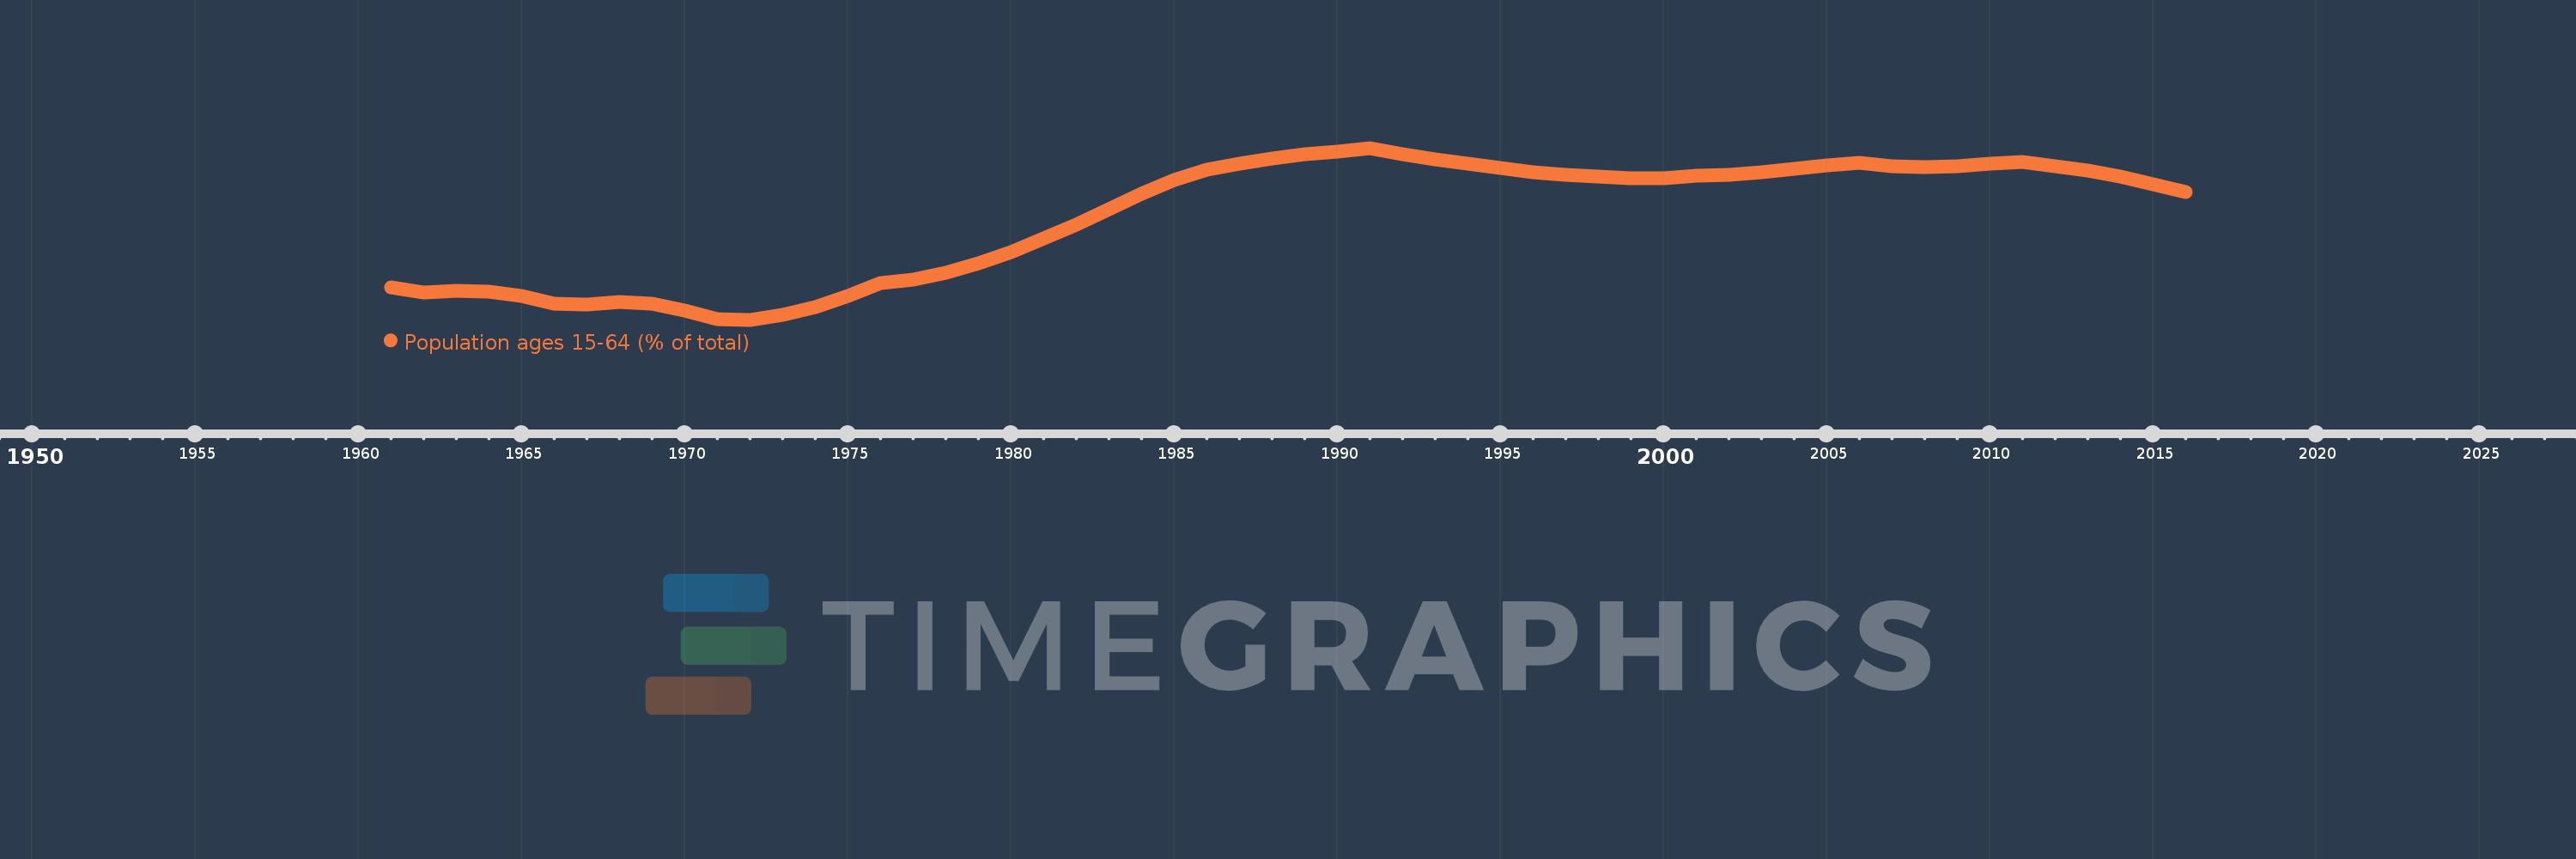
Population ages 15-64 (% of total)
2016,2015,2014,2013,2012,2011,2010,2009,2008,2007,2006,2005,2004,2003,2002,2001,2000,1999,1998,1997,1996,1995,1994,1993,1992,1991,1990,1989,1988,1987,1986,1985,1984,1983,1982,1981,1980,1979,1978,1977,1976,1975,1974,1973,1972,1971,1970,1969,1968,1967,1966,1965,1964,1963,1962,1961
This statistics in other country:
AfghanistanAlbaniaAlgeriaAngolaAntigua and BarbudaArab WorldArgentinaArmeniaArubaAustraliaAustriaAzerbaijanBahamas, TheBahrainBangladeshBarbadosBelarusBelgiumBelizeBeninBhutanBoliviaBosnia and HerzegovinaBotswanaBrazilBrunei DarussalamBulgariaBurkina FasoBurundiCabo VerdeCambodiaCameroonCanadaCaribbean small statesCentral African RepublicCentral Europe and the BalticsChadChannel IslandsChileChinaColombiaComorosCongo, Dem. Rep.Congo, Rep.Costa RicaCote d'IvoireCroatiaCubaCuracaoCyprusCzech RepublicDenmarkDjiboutiDominican RepublicEarly-demographic dividendEast Asia & PacificEast Asia & Pacific (excluding high income)East Asia & Pacific (IDA & IBRD countries)EcuadorEgypt, Arab Rep.El SalvadorEquatorial GuineaEritreaEstoniaEthiopiaEuro areaEurope & Central AsiaEurope & Central Asia (excluding high income)Europe & Central Asia (IDA & IBRD countries)European UnionFijiFinlandFragile and conflict affected situationsFranceFrench PolynesiaGabonGambia, TheGeorgiaGermanyGhanaGreeceGrenadaGuamGuatemalaGuineaGuinea-BissauGuyanaHaitiHeavily indebted poor countries (HIPC)High incomeHondurasHong Kong SAR, ChinaHungaryIBRD onlyIcelandIDA & IBRD totalIDA blendIDA onlyIDA totalIndiaIndonesiaIran, Islamic Rep.IraqIrelandIsraelItalyJamaicaJapanJordanKazakhstanKenyaKiribatiKorea, Dem. People’s Rep.Korea, Rep.KosovoKuwaitKyrgyz RepublicLao PDRLate-demographic dividendLatin America & Caribbean Latin America & Caribbean (excluding high income)Latin America & the Caribbean (IDA & IBRD countries)LatviaLeast developed countries: UN classificationLebanonLesothoLiberiaLibyaLithuaniaLow & middle incomeLow incomeLower middle incomeLuxembourgMacao SAR, ChinaMacedonia, FYRMadagascarMalawiMalaysiaMaldivesMaliMaltaMauritaniaMauritiusMexicoMicronesia, Fed. Sts.Middle East & North AfricaMiddle East & North Africa (excluding high income)Middle East & North Africa (IDA & IBRD countries)Middle incomeMoldovaMongoliaMontenegroMoroccoMozambiqueMyanmarNamibiaNepalNetherlandsNew CaledoniaNew ZealandNicaraguaNigerNigeriaNorth AmericaNorwayOECD membersOmanOther small statesPacific island small statesPakistanPanamaPapua New GuineaParaguayPeruPhilippinesPolandPortugalPost-demographic dividendPre-demographic dividendPuerto RicoQatarRomaniaRussian FederationRwandaSamoaSao Tome and PrincipeSaudi ArabiaSenegalSerbiaSeychellesSierra LeoneSingaporeSlovak RepublicSloveniaSmall statesSolomon IslandsSomaliaSouth AfricaSouth AsiaSouth Asia (IDA & IBRD)South SudanSpainSri LankaSt. LuciaSt. Vincent and the GrenadinesSub-Saharan Africa Sub-Saharan Africa (excluding high income)Sub-Saharan Africa (IDA & IBRD countries)SudanSurinameSwazilandSwedenSwitzerlandSyrian Arab RepublicTajikistanTanzaniaThailandTimor-LesteTogoTongaTrinidad and TobagoTunisiaTurkeyTurkmenistanUgandaUkraineUnited Arab EmiratesUnited KingdomUnited StatesUpper middle incomeUruguayUzbekistanVanuatuVenezuela, RBVietnamVirgin Islands (U.S.)West Bank and GazaWorldYemen, Rep.ZambiaZimbabwe Timeline:
This timeline shows a graph from 1961 to 2016 of Channel Islands. No data until 1960. Number of actual observations by date: 56.
Source name:
World Development Indicators
Source organization:
World Bank staff estimates based on age distributions of United Nations Population Division's World Population Prospects.
Categories, topics:
Education, Health
Last updated:
apr 23, 2017
Indicators value changes by year
Minimum:
64.396
jan 1, 1972
At the date of observation
Value
Absolute change
Change from previous value
jan 1, 1961
65.315
+65.315
0.0%
jan 1, 1962
65.172
-0.143
-0.22%
jan 1, 1963
65.211
+0.039
0.06%
jan 1, 1964
65.206
-0.005
-0.01%
jan 1, 1965
65.072
-0.134
-0.21%
jan 1, 1966
64.861
-0.211
-0.32%
jan 1, 1967
64.833
-0.028
-0.04%
jan 1, 1968
64.902
+0.069
0.11%
jan 1, 1969
64.857
-0.045
-0.07%
jan 1, 1970
64.661
-0.195
-0.3%
jan 1, 1971
64.415
-0.246
-0.38%
jan 1, 1972
64.396
-0.02
-0.03%
jan 1, 1973
64.523
+0.127
0.2%
jan 1, 1974
64.753
+0.23
0.36%
jan 1, 1975
65.063
+0.31
0.48%
jan 1, 1976
65.431
+0.368
0.57%
jan 1, 1977
65.544
+0.113
0.17%
jan 1, 1978
65.729
+0.185
0.28%
jan 1, 1979
65.989
+0.26
0.4%
jan 1, 1980
66.323
+0.334
0.51%
jan 1, 1981
66.712
+0.389
0.59%
jan 1, 1982
67.096
+0.385
0.58%
jan 1, 1983
67.539
+0.443
0.66%
jan 1, 1984
67.977
+0.438
0.65%
jan 1, 1985
68.357
+0.381
0.56%
jan 1, 1986
68.664
+0.307
0.45%
jan 1, 1987
68.836
+0.172
0.25%
jan 1, 1988
68.991
+0.155
0.23%
jan 1, 1989
69.098
+0.107
0.16%
jan 1, 1990
69.184
+0.086
0.12%
jan 1, 1991
69.28
+0.096
0.14%
jan 1, 1992
69.09
-0.189
-0.27%
jan 1, 1993
68.958
-0.133
-0.19%
jan 1, 1994
68.845
-0.113
-0.16%
jan 1, 1995
68.717
-0.128
-0.19%
jan 1, 1996
68.587
-0.13
-0.19%
jan 1, 1997
68.521
-0.066
-0.1%
jan 1, 1998
68.46
-0.061
-0.09%
jan 1, 1999
68.421
-0.04
-0.06%
jan 1, 2000
68.427
+0.007
0.01%
jan 1, 2001
68.497
+0.069
0.1%
jan 1, 2002
68.519
+0.023
0.03%
jan 1, 2003
68.585
+0.065
0.1%
jan 1, 2004
68.684
+0.099
0.14%
jan 1, 2005
68.789
+0.105
0.15%
jan 1, 2006
68.863
+0.074
0.11%
jan 1, 2007
68.767
-0.095
-0.14%
jan 1, 2008
68.731
-0.037
-0.05%
jan 1, 2009
68.757
+0.026
0.04%
jan 1, 2010
68.823
+0.066
0.1%
jan 1, 2011
68.88
+0.057
0.08%
jan 1, 2012
68.764
-0.115
-0.17%
jan 1, 2013
68.627
-0.137
-0.2%
jan 1, 2014
68.455
-0.172
-0.25%
jan 1, 2015
68.253
-0.202
-0.3%
jan 1, 2016
68.023
-0.23
-0.34%
Ranking of countries by current statistics by years


Comments: