29
/
en
AIzaSyAYiBZKx7MnpbEhh9jyipgxe19OcubqV5w
April 1, 2024
39373
IDA only
IDX
false
2
1
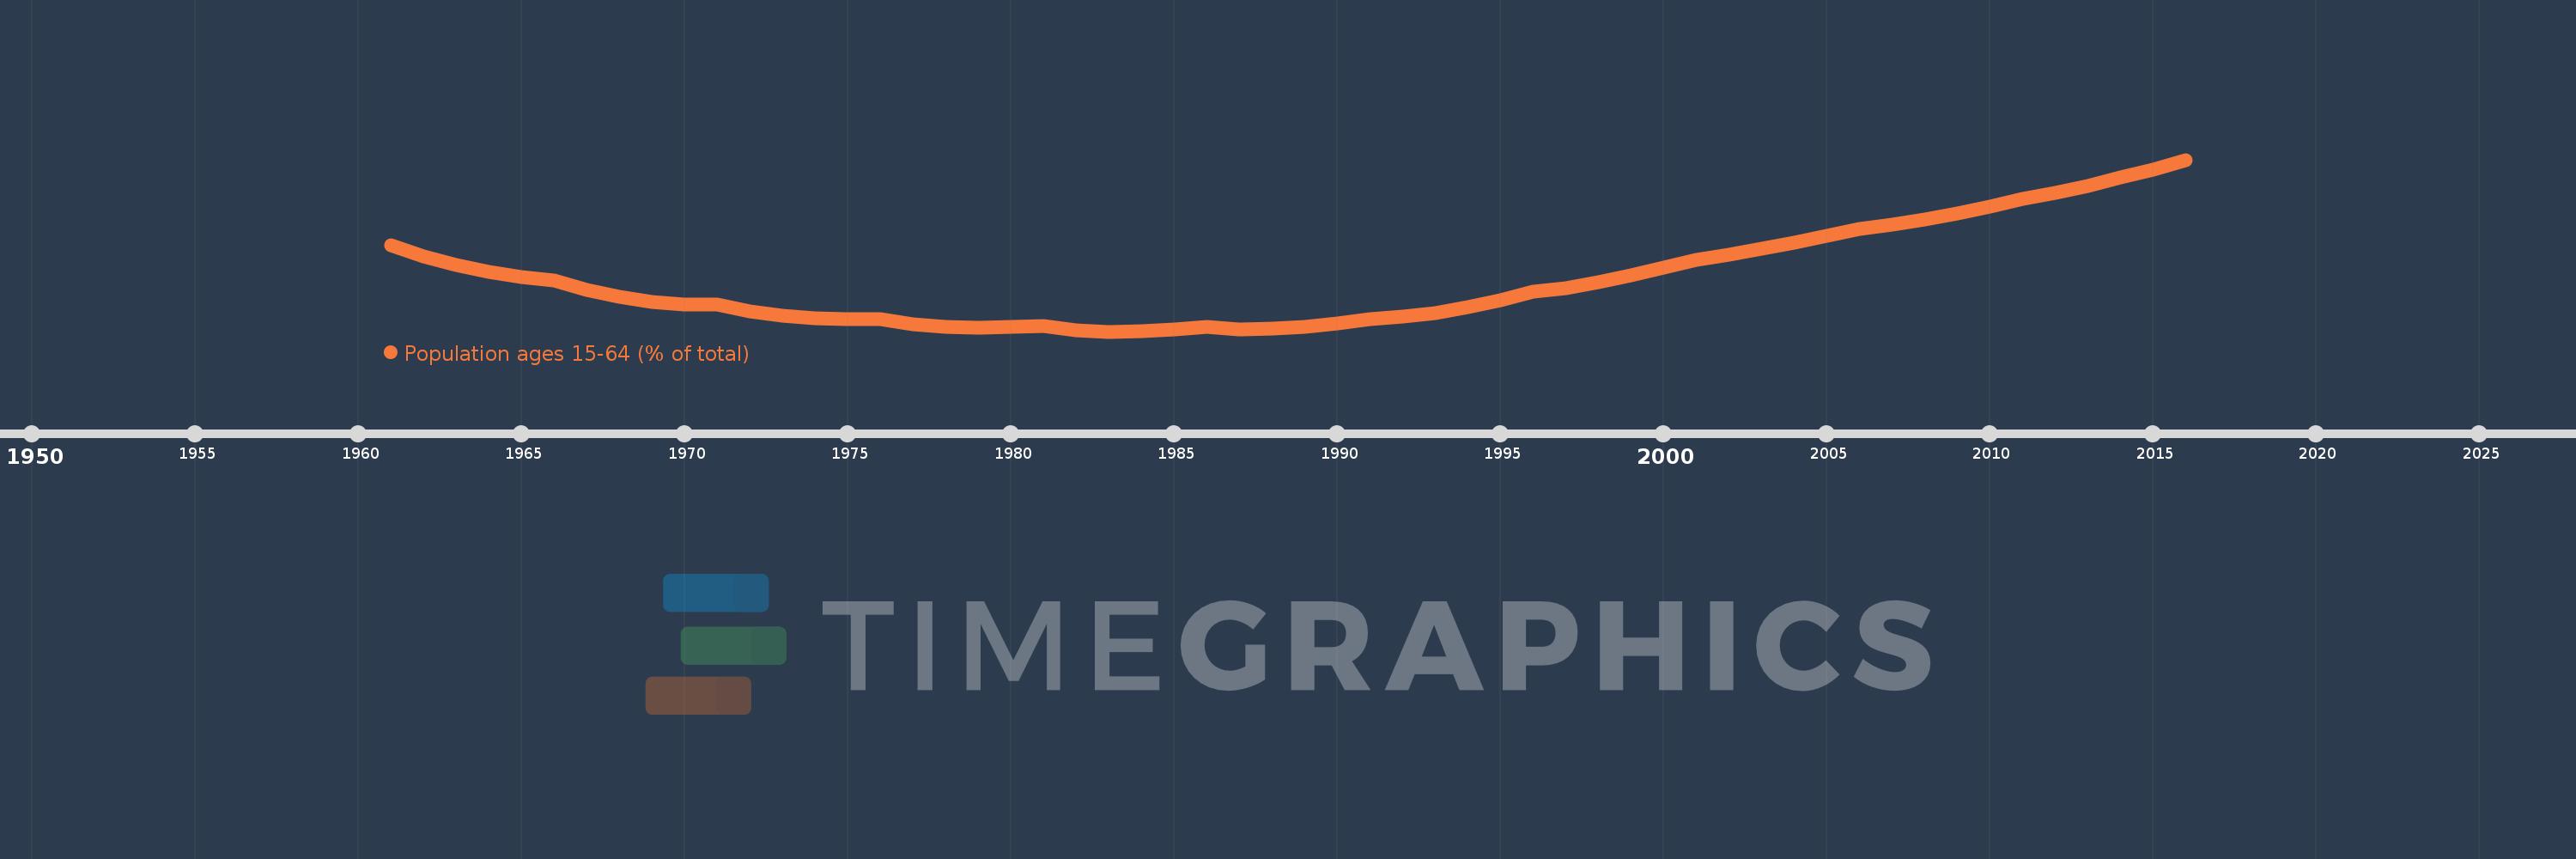
Population ages 15-64 (% of total)
2016,2015,2014,2013,2012,2011,2010,2009,2008,2007,2006,2005,2004,2003,2002,2001,2000,1999,1998,1997,1996,1995,1994,1993,1992,1991,1990,1989,1988,1987,1986,1985,1984,1983,1982,1981,1980,1979,1978,1977,1976,1975,1974,1973,1972,1971,1970,1969,1968,1967,1966,1965,1964,1963,1962,1961
This statistics in other country:
AfghanistanAlbaniaAlgeriaAngolaAntigua and BarbudaArab WorldArgentinaArmeniaArubaAustraliaAustriaAzerbaijanBahamas, TheBahrainBangladeshBarbadosBelarusBelgiumBelizeBeninBhutanBoliviaBosnia and HerzegovinaBotswanaBrazilBrunei DarussalamBulgariaBurkina FasoBurundiCabo VerdeCambodiaCameroonCanadaCaribbean small statesCentral African RepublicCentral Europe and the BalticsChadChannel IslandsChileChinaColombiaComorosCongo, Dem. Rep.Congo, Rep.Costa RicaCote d'IvoireCroatiaCubaCuracaoCyprusCzech RepublicDenmarkDjiboutiDominican RepublicEarly-demographic dividendEast Asia & PacificEast Asia & Pacific (excluding high income)East Asia & Pacific (IDA & IBRD countries)EcuadorEgypt, Arab Rep.El SalvadorEquatorial GuineaEritreaEstoniaEthiopiaEuro areaEurope & Central AsiaEurope & Central Asia (excluding high income)Europe & Central Asia (IDA & IBRD countries)European UnionFijiFinlandFragile and conflict affected situationsFranceFrench PolynesiaGabonGambia, TheGeorgiaGermanyGhanaGreeceGrenadaGuamGuatemalaGuineaGuinea-BissauGuyanaHaitiHeavily indebted poor countries (HIPC)High incomeHondurasHong Kong SAR, ChinaHungaryIBRD onlyIcelandIDA & IBRD totalIDA blendIDA onlyIDA totalIndiaIndonesiaIran, Islamic Rep.IraqIrelandIsraelItalyJamaicaJapanJordanKazakhstanKenyaKiribatiKorea, Dem. People’s Rep.Korea, Rep.KosovoKuwaitKyrgyz RepublicLao PDRLate-demographic dividendLatin America & Caribbean Latin America & Caribbean (excluding high income)Latin America & the Caribbean (IDA & IBRD countries)LatviaLeast developed countries: UN classificationLebanonLesothoLiberiaLibyaLithuaniaLow & middle incomeLow incomeLower middle incomeLuxembourgMacao SAR, ChinaMacedonia, FYRMadagascarMalawiMalaysiaMaldivesMaliMaltaMauritaniaMauritiusMexicoMicronesia, Fed. Sts.Middle East & North AfricaMiddle East & North Africa (excluding high income)Middle East & North Africa (IDA & IBRD countries)Middle incomeMoldovaMongoliaMontenegroMoroccoMozambiqueMyanmarNamibiaNepalNetherlandsNew CaledoniaNew ZealandNicaraguaNigerNigeriaNorth AmericaNorwayOECD membersOmanOther small statesPacific island small statesPakistanPanamaPapua New GuineaParaguayPeruPhilippinesPolandPortugalPost-demographic dividendPre-demographic dividendPuerto RicoQatarRomaniaRussian FederationRwandaSamoaSao Tome and PrincipeSaudi ArabiaSenegalSerbiaSeychellesSierra LeoneSingaporeSlovak RepublicSloveniaSmall statesSolomon IslandsSomaliaSouth AfricaSouth AsiaSouth Asia (IDA & IBRD)South SudanSpainSri LankaSt. LuciaSt. Vincent and the GrenadinesSub-Saharan Africa Sub-Saharan Africa (excluding high income)Sub-Saharan Africa (IDA & IBRD countries)SudanSurinameSwazilandSwedenSwitzerlandSyrian Arab RepublicTajikistanTanzaniaThailandTimor-LesteTogoTongaTrinidad and TobagoTunisiaTurkeyTurkmenistanUgandaUkraineUnited Arab EmiratesUnited KingdomUnited StatesUpper middle incomeUruguayUzbekistanVanuatuVenezuela, RBVietnamVirgin Islands (U.S.)West Bank and GazaWorldYemen, Rep.ZambiaZimbabwe Timeline:
This timeline shows a graph from 1961 to 2016 of IDA only. No data until 1960. Number of actual observations by date: 56.
Source name:
World Development Indicators
Source organization:
World Bank staff estimates based on age distributions of United Nations Population Division's World Population Prospects.
Categories, topics:
Education, Health
Last updated:
apr 23, 2017
Indicators value changes by year
Maximum:
56.807
jan 1, 2016
At the date of observation
Value
Absolute change
Change from previous value
jan 1, 1961
54.288
+54.288
0.0%
jan 1, 1962
53.958
-0.33
-0.61%
jan 1, 1963
53.699
-0.259
-0.48%
jan 1, 1964
53.5
-0.2
-0.37%
jan 1, 1965
53.354
-0.146
-0.27%
jan 1, 1966
53.256
-0.097
-0.18%
jan 1, 1967
52.966
-0.29
-0.54%
jan 1, 1968
52.76
-0.207
-0.39%
jan 1, 1969
52.623
-0.137
-0.26%
jan 1, 1970
52.546
-0.076
-0.15%
jan 1, 1971
52.528
-0.018
-0.03%
jan 1, 1972
52.332
-0.196
-0.37%
jan 1, 1973
52.206
-0.126
-0.24%
jan 1, 1974
52.135
-0.071
-0.14%
jan 1, 1975
52.104
-0.031
-0.06%
jan 1, 1976
52.103
-0.001
0.0%
jan 1, 1977
51.966
-0.137
-0.26%
jan 1, 1978
51.89
-0.076
-0.15%
jan 1, 1979
51.86
-0.03
-0.06%
jan 1, 1980
51.868
+0.008
0.02%
jan 1, 1981
51.91
+0.041
0.08%
jan 1, 1982
51.788
-0.121
-0.23%
jan 1, 1983
51.74
-0.048
-0.09%
jan 1, 1984
51.748
+0.008
0.02%
jan 1, 1985
51.796
+0.048
0.09%
jan 1, 1986
51.875
+0.079
0.15%
jan 1, 1987
51.815
-0.06
-0.12%
jan 1, 1988
51.818
+0.003
0.01%
jan 1, 1989
51.872
+0.055
0.11%
jan 1, 1990
51.972
+0.099
0.19%
jan 1, 1991
52.111
+0.14
0.27%
jan 1, 1992
52.173
+0.062
0.12%
jan 1, 1993
52.293
+0.119
0.23%
jan 1, 1994
52.46
+0.167
0.32%
jan 1, 1995
52.668
+0.208
0.4%
jan 1, 1996
52.913
+0.245
0.47%
jan 1, 1997
53.031
+0.118
0.22%
jan 1, 1998
53.194
+0.163
0.31%
jan 1, 1999
53.393
+0.199
0.37%
jan 1, 2000
53.621
+0.228
0.43%
jan 1, 2001
53.868
+0.248
0.46%
jan 1, 2002
54.006
+0.138
0.26%
jan 1, 2003
54.175
+0.169
0.31%
jan 1, 2004
54.364
+0.188
0.35%
jan 1, 2005
54.562
+0.198
0.36%
jan 1, 2006
54.767
+0.205
0.38%
jan 1, 2007
54.9
+0.133
0.24%
jan 1, 2008
55.056
+0.156
0.28%
jan 1, 2009
55.232
+0.176
0.32%
jan 1, 2010
55.427
+0.195
0.35%
jan 1, 2011
55.66
+0.232
0.42%
jan 1, 2012
55.831
+0.172
0.31%
jan 1, 2013
56.044
+0.213
0.38%
jan 1, 2014
56.277
+0.233
0.42%
jan 1, 2015
56.526
+0.25
0.44%
jan 1, 2016
56.807
+0.28
0.5%
Ranking of countries by current statistics by years


Comments: