29
/
en
AIzaSyAYiBZKx7MnpbEhh9jyipgxe19OcubqV5w
April 1, 2024
150888
Honduras
HND
true
2
1
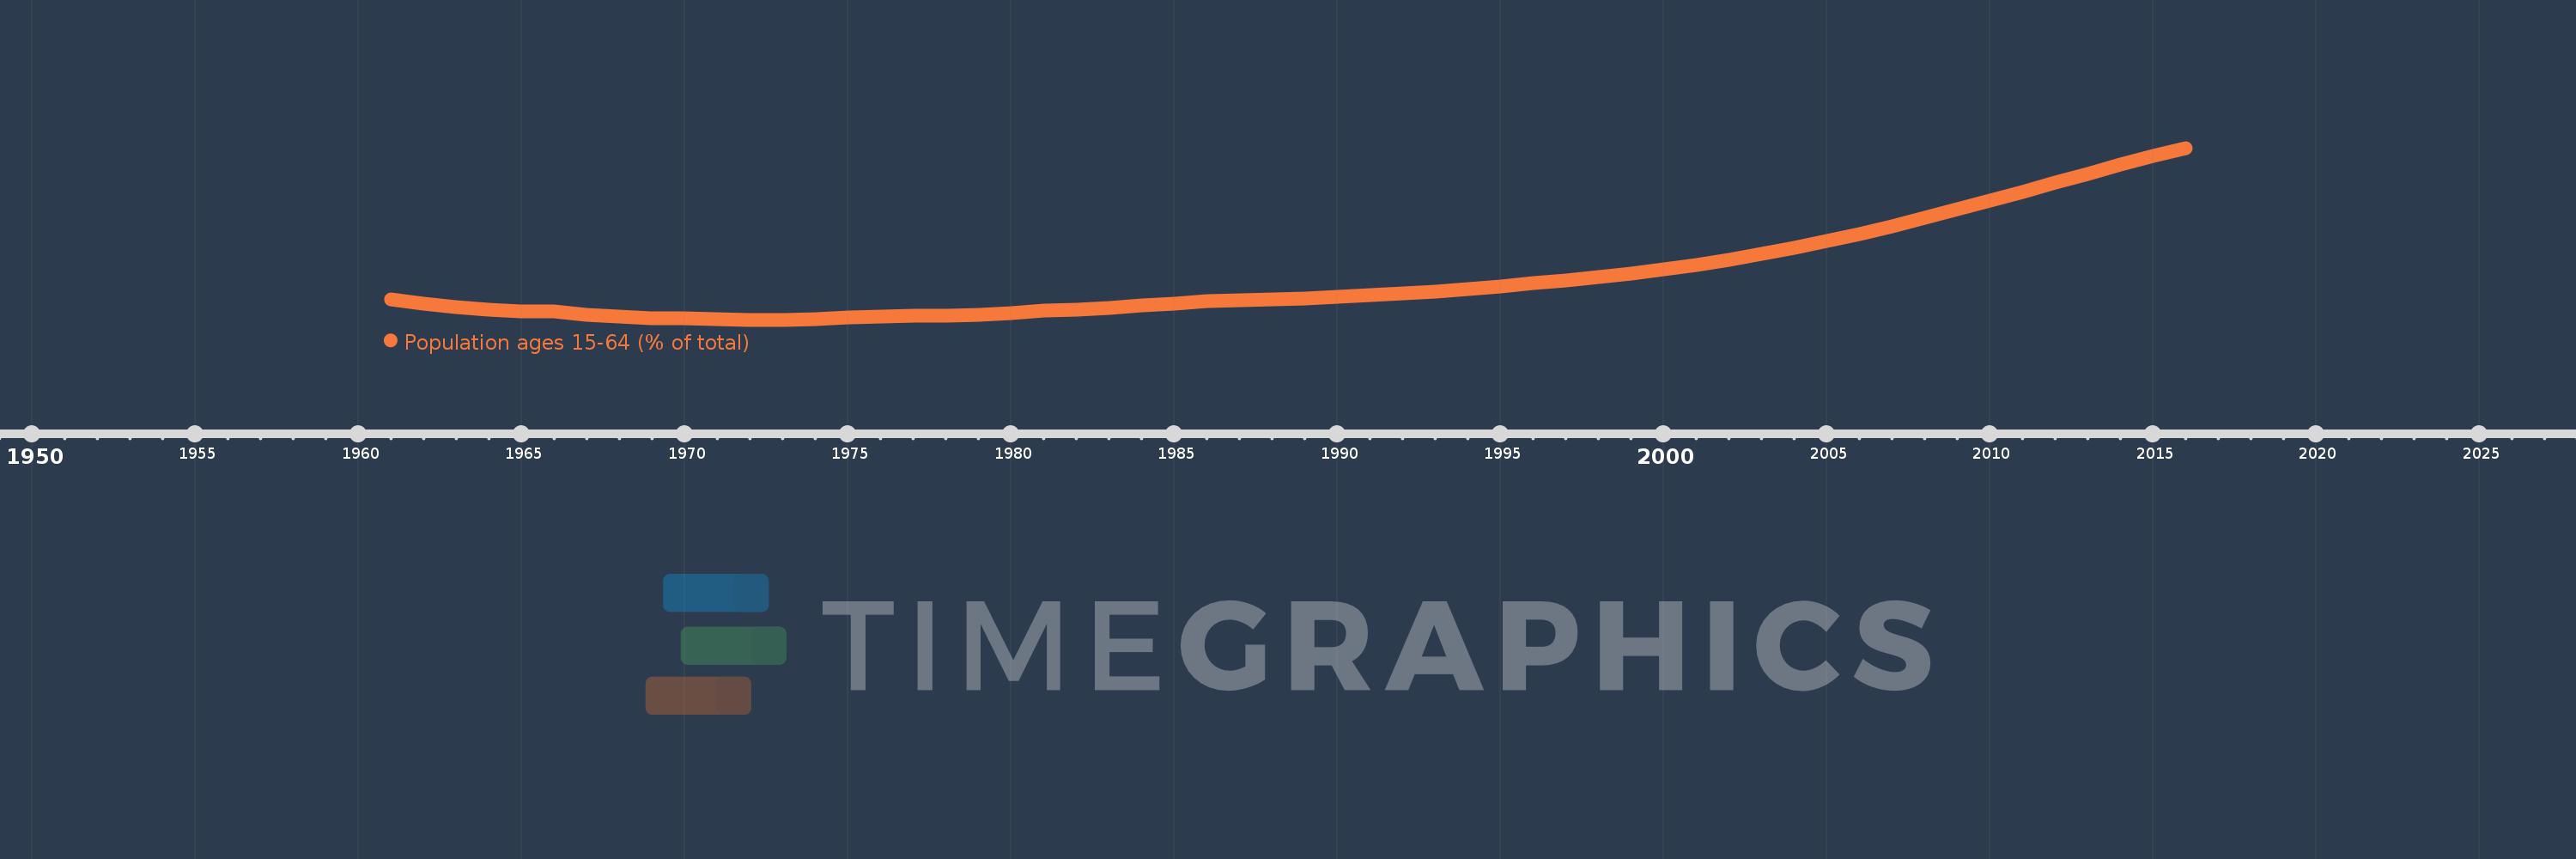
Population ages 15-64 (% of total)
2016,2015,2014,2013,2012,2011,2010,2009,2008,2007,2006,2005,2004,2003,2002,2001,2000,1999,1998,1997,1996,1995,1994,1993,1992,1991,1990,1989,1988,1987,1986,1985,1984,1983,1982,1981,1980,1979,1978,1977,1976,1975,1974,1973,1972,1971,1970,1969,1968,1967,1966,1965,1964,1963,1962,1961
This statistics in other country:
AfghanistanAlbaniaAlgeriaAngolaAntigua and BarbudaArab WorldArgentinaArmeniaArubaAustraliaAustriaAzerbaijanBahamas, TheBahrainBangladeshBarbadosBelarusBelgiumBelizeBeninBhutanBoliviaBosnia and HerzegovinaBotswanaBrazilBrunei DarussalamBulgariaBurkina FasoBurundiCabo VerdeCambodiaCameroonCanadaCaribbean small statesCentral African RepublicCentral Europe and the BalticsChadChannel IslandsChileChinaColombiaComorosCongo, Dem. Rep.Congo, Rep.Costa RicaCote d'IvoireCroatiaCubaCuracaoCyprusCzech RepublicDenmarkDjiboutiDominican RepublicEarly-demographic dividendEast Asia & PacificEast Asia & Pacific (excluding high income)East Asia & Pacific (IDA & IBRD countries)EcuadorEgypt, Arab Rep.El SalvadorEquatorial GuineaEritreaEstoniaEthiopiaEuro areaEurope & Central AsiaEurope & Central Asia (excluding high income)Europe & Central Asia (IDA & IBRD countries)European UnionFijiFinlandFragile and conflict affected situationsFranceFrench PolynesiaGabonGambia, TheGeorgiaGermanyGhanaGreeceGrenadaGuamGuatemalaGuineaGuinea-BissauGuyanaHaitiHeavily indebted poor countries (HIPC)High incomeHondurasHong Kong SAR, ChinaHungaryIBRD onlyIcelandIDA & IBRD totalIDA blendIDA onlyIDA totalIndiaIndonesiaIran, Islamic Rep.IraqIrelandIsraelItalyJamaicaJapanJordanKazakhstanKenyaKiribatiKorea, Dem. People’s Rep.Korea, Rep.KosovoKuwaitKyrgyz RepublicLao PDRLate-demographic dividendLatin America & Caribbean Latin America & Caribbean (excluding high income)Latin America & the Caribbean (IDA & IBRD countries)LatviaLeast developed countries: UN classificationLebanonLesothoLiberiaLibyaLithuaniaLow & middle incomeLow incomeLower middle incomeLuxembourgMacao SAR, ChinaMacedonia, FYRMadagascarMalawiMalaysiaMaldivesMaliMaltaMauritaniaMauritiusMexicoMicronesia, Fed. Sts.Middle East & North AfricaMiddle East & North Africa (excluding high income)Middle East & North Africa (IDA & IBRD countries)Middle incomeMoldovaMongoliaMontenegroMoroccoMozambiqueMyanmarNamibiaNepalNetherlandsNew CaledoniaNew ZealandNicaraguaNigerNigeriaNorth AmericaNorwayOECD membersOmanOther small statesPacific island small statesPakistanPanamaPapua New GuineaParaguayPeruPhilippinesPolandPortugalPost-demographic dividendPre-demographic dividendPuerto RicoQatarRomaniaRussian FederationRwandaSamoaSao Tome and PrincipeSaudi ArabiaSenegalSerbiaSeychellesSierra LeoneSingaporeSlovak RepublicSloveniaSmall statesSolomon IslandsSomaliaSouth AfricaSouth AsiaSouth Asia (IDA & IBRD)South SudanSpainSri LankaSt. LuciaSt. Vincent and the GrenadinesSub-Saharan Africa Sub-Saharan Africa (excluding high income)Sub-Saharan Africa (IDA & IBRD countries)SudanSurinameSwazilandSwedenSwitzerlandSyrian Arab RepublicTajikistanTanzaniaThailandTimor-LesteTogoTongaTrinidad and TobagoTunisiaTurkeyTurkmenistanUgandaUkraineUnited Arab EmiratesUnited KingdomUnited StatesUpper middle incomeUruguayUzbekistanVanuatuVenezuela, RBVietnamVirgin Islands (U.S.)West Bank and GazaWorldYemen, Rep.ZambiaZimbabwe Timeline:
This timeline shows a graph from 1961 to 2016 of Honduras. No data until 1960. Number of actual observations by date: 56.
Source name:
World Development Indicators
Source organization:
World Bank staff estimates based on age distributions of United Nations Population Division's World Population Prospects.
Categories, topics:
Education, Health
Last updated:
apr 23, 2017
Indicators value changes by year
Minimum:
49.084
jan 1, 1972
Maximum:
63.384
jan 1, 2016
At the date of observation
Value
Absolute change
Change from previous value
jan 1, 1961
50.755
+50.755
0.0%
jan 1, 1962
50.412
-0.344
-0.68%
jan 1, 1963
50.116
-0.296
-0.59%
jan 1, 1964
49.89
-0.226
-0.45%
jan 1, 1965
49.772
-0.117
-0.24%
jan 1, 1966
49.777
+0.004
0.01%
jan 1, 1967
49.492
-0.285
-0.57%
jan 1, 1968
49.314
-0.178
-0.36%
jan 1, 1969
49.218
-0.096
-0.2%
jan 1, 1970
49.173
-0.044
-0.09%
jan 1, 1971
49.166
-0.007
-0.01%
jan 1, 1972
49.084
-0.082
-0.17%
jan 1, 1973
49.097
+0.012
0.03%
jan 1, 1974
49.166
+0.069
0.14%
jan 1, 1975
49.251
+0.085
0.17%
jan 1, 1976
49.332
+0.081
0.16%
jan 1, 1977
49.402
+0.071
0.14%
jan 1, 1978
49.455
+0.053
0.11%
jan 1, 1979
49.518
+0.063
0.13%
jan 1, 1980
49.634
+0.116
0.23%
jan 1, 1981
49.818
+0.184
0.37%
jan 1, 1982
49.886
+0.068
0.14%
jan 1, 1983
50.043
+0.157
0.31%
jan 1, 1984
50.246
+0.203
0.41%
jan 1, 1985
50.44
+0.194
0.39%
jan 1, 1986
50.605
+0.164
0.33%
jan 1, 1987
50.699
+0.094
0.19%
jan 1, 1988
50.785
+0.087
0.17%
jan 1, 1989
50.875
+0.09
0.18%
jan 1, 1990
50.99
+0.114
0.22%
jan 1, 1991
51.14
+0.151
0.3%
jan 1, 1992
51.288
+0.148
0.29%
jan 1, 1993
51.449
+0.161
0.31%
jan 1, 1994
51.632
+0.183
0.36%
jan 1, 1995
51.849
+0.217
0.42%
jan 1, 1996
52.105
+0.256
0.49%
jan 1, 1997
52.336
+0.23
0.44%
jan 1, 1998
52.612
+0.276
0.53%
jan 1, 1999
52.925
+0.313
0.6%
jan 1, 2000
53.265
+0.339
0.64%
jan 1, 2001
53.629
+0.364
0.68%
jan 1, 2002
54.076
+0.447
0.83%
jan 1, 2003
54.554
+0.478
0.88%
jan 1, 2004
55.063
+0.509
0.93%
jan 1, 2005
55.608
+0.545
0.99%
jan 1, 2006
56.189
+0.581
1.05%
jan 1, 2007
56.863
+0.674
1.2%
jan 1, 2008
57.553
+0.689
1.21%
jan 1, 2009
58.259
+0.707
1.23%
jan 1, 2010
58.987
+0.728
1.25%
jan 1, 2011
59.733
+0.746
1.26%
jan 1, 2012
60.481
+0.747
1.25%
jan 1, 2013
61.25
+0.77
1.27%
jan 1, 2014
62.015
+0.765
1.25%
jan 1, 2015
62.735
+0.72
1.16%
jan 1, 2016
63.384
+0.649
1.03%
Ranking of countries by current statistics by years


Comments: