29
/
en
AIzaSyAYiBZKx7MnpbEhh9jyipgxe19OcubqV5w
April 1, 2024
280216
Vanuatu
VUT
true
2
1
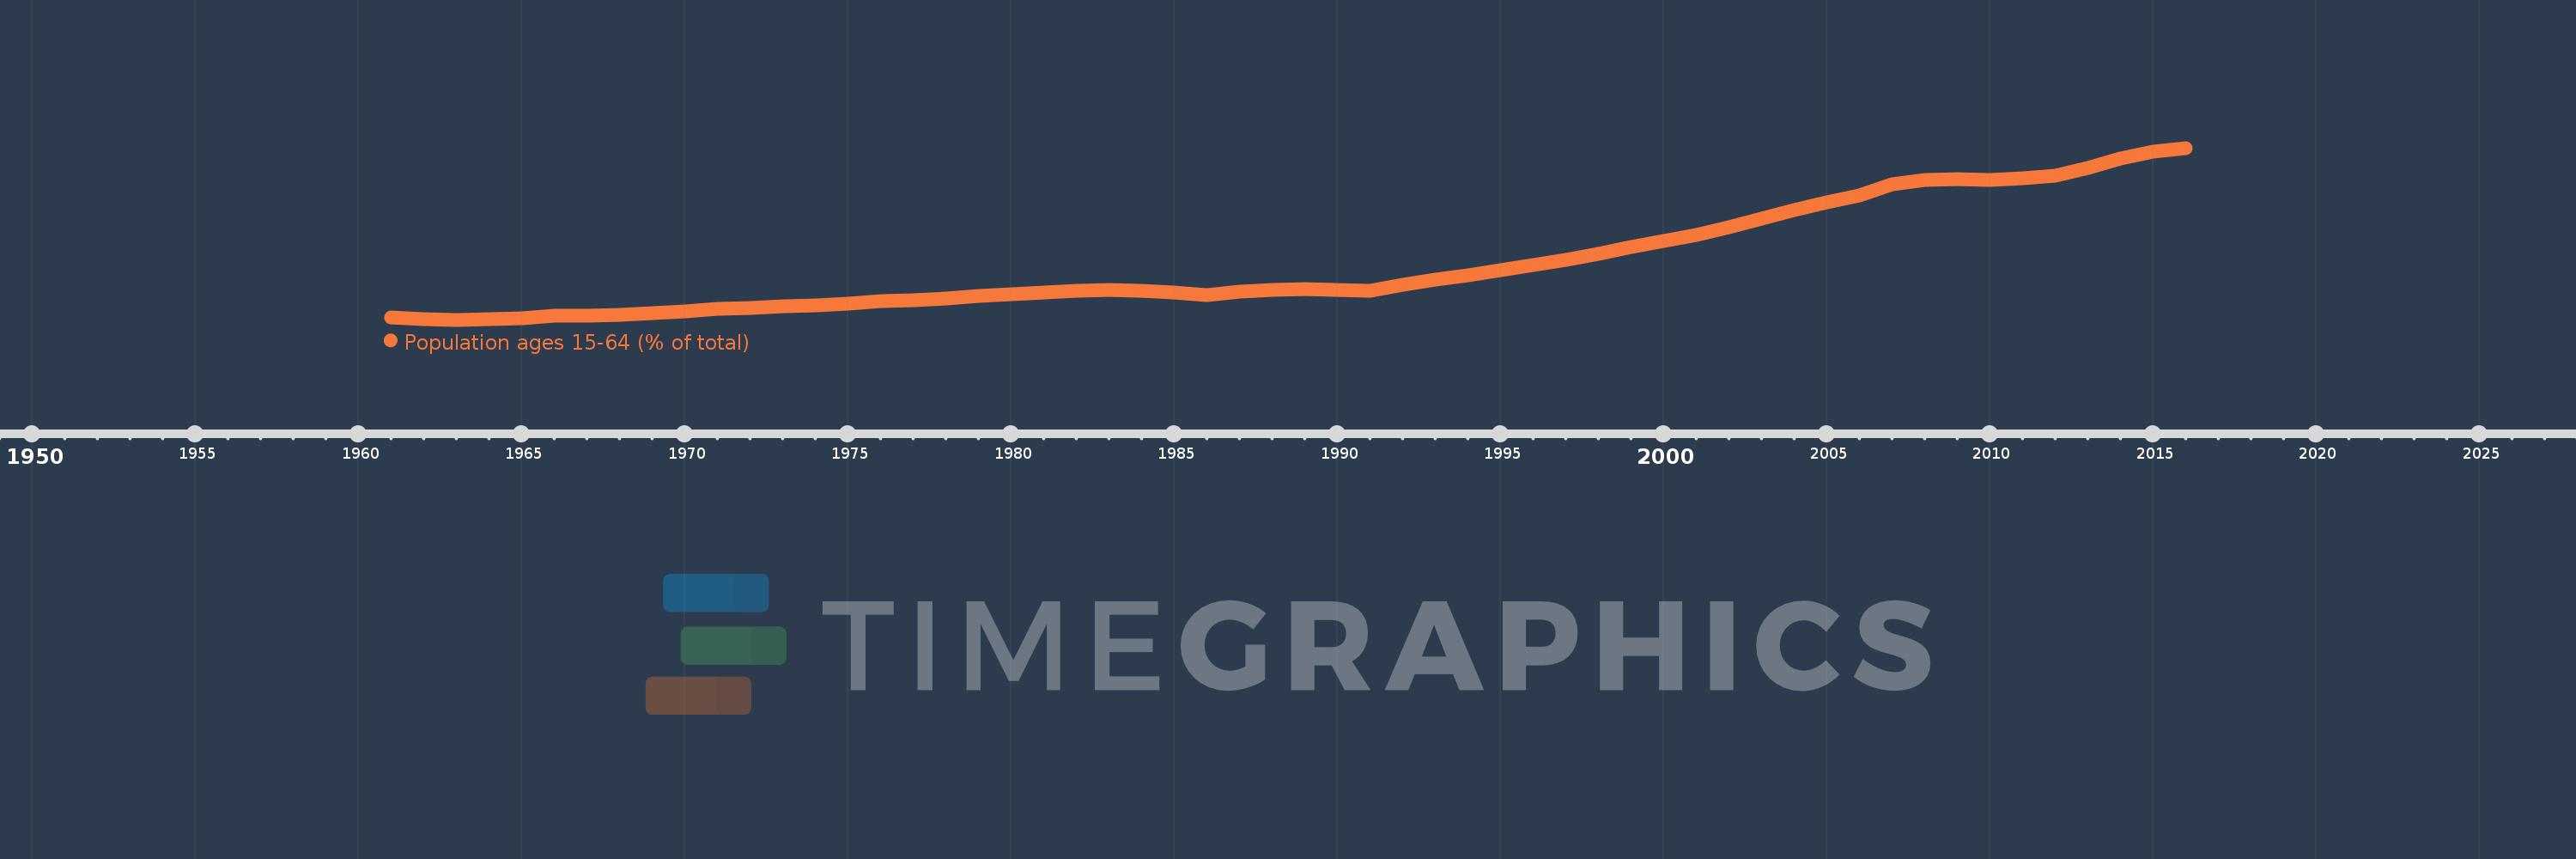
Population ages 15-64 (% of total)
2016,2015,2014,2013,2012,2011,2010,2009,2008,2007,2006,2005,2004,2003,2002,2001,2000,1999,1998,1997,1996,1995,1994,1993,1992,1991,1990,1989,1988,1987,1986,1985,1984,1983,1982,1981,1980,1979,1978,1977,1976,1975,1974,1973,1972,1971,1970,1969,1968,1967,1966,1965,1964,1963,1962,1961
This statistics in other country:
AfghanistanAlbaniaAlgeriaAngolaAntigua and BarbudaArab WorldArgentinaArmeniaArubaAustraliaAustriaAzerbaijanBahamas, TheBahrainBangladeshBarbadosBelarusBelgiumBelizeBeninBhutanBoliviaBosnia and HerzegovinaBotswanaBrazilBrunei DarussalamBulgariaBurkina FasoBurundiCabo VerdeCambodiaCameroonCanadaCaribbean small statesCentral African RepublicCentral Europe and the BalticsChadChannel IslandsChileChinaColombiaComorosCongo, Dem. Rep.Congo, Rep.Costa RicaCote d'IvoireCroatiaCubaCuracaoCyprusCzech RepublicDenmarkDjiboutiDominican RepublicEarly-demographic dividendEast Asia & PacificEast Asia & Pacific (excluding high income)East Asia & Pacific (IDA & IBRD countries)EcuadorEgypt, Arab Rep.El SalvadorEquatorial GuineaEritreaEstoniaEthiopiaEuro areaEurope & Central AsiaEurope & Central Asia (excluding high income)Europe & Central Asia (IDA & IBRD countries)European UnionFijiFinlandFragile and conflict affected situationsFranceFrench PolynesiaGabonGambia, TheGeorgiaGermanyGhanaGreeceGrenadaGuamGuatemalaGuineaGuinea-BissauGuyanaHaitiHeavily indebted poor countries (HIPC)High incomeHondurasHong Kong SAR, ChinaHungaryIBRD onlyIcelandIDA & IBRD totalIDA blendIDA onlyIDA totalIndiaIndonesiaIran, Islamic Rep.IraqIrelandIsraelItalyJamaicaJapanJordanKazakhstanKenyaKiribatiKorea, Dem. People’s Rep.Korea, Rep.KosovoKuwaitKyrgyz RepublicLao PDRLate-demographic dividendLatin America & Caribbean Latin America & Caribbean (excluding high income)Latin America & the Caribbean (IDA & IBRD countries)LatviaLeast developed countries: UN classificationLebanonLesothoLiberiaLibyaLithuaniaLow & middle incomeLow incomeLower middle incomeLuxembourgMacao SAR, ChinaMacedonia, FYRMadagascarMalawiMalaysiaMaldivesMaliMaltaMauritaniaMauritiusMexicoMicronesia, Fed. Sts.Middle East & North AfricaMiddle East & North Africa (excluding high income)Middle East & North Africa (IDA & IBRD countries)Middle incomeMoldovaMongoliaMontenegroMoroccoMozambiqueMyanmarNamibiaNepalNetherlandsNew CaledoniaNew ZealandNicaraguaNigerNigeriaNorth AmericaNorwayOECD membersOmanOther small statesPacific island small statesPakistanPanamaPapua New GuineaParaguayPeruPhilippinesPolandPortugalPost-demographic dividendPre-demographic dividendPuerto RicoQatarRomaniaRussian FederationRwandaSamoaSao Tome and PrincipeSaudi ArabiaSenegalSerbiaSeychellesSierra LeoneSingaporeSlovak RepublicSloveniaSmall statesSolomon IslandsSomaliaSouth AfricaSouth AsiaSouth Asia (IDA & IBRD)South SudanSpainSri LankaSt. LuciaSt. Vincent and the GrenadinesSub-Saharan Africa Sub-Saharan Africa (excluding high income)Sub-Saharan Africa (IDA & IBRD countries)SudanSurinameSwazilandSwedenSwitzerlandSyrian Arab RepublicTajikistanTanzaniaThailandTimor-LesteTogoTongaTrinidad and TobagoTunisiaTurkeyTurkmenistanUgandaUkraineUnited Arab EmiratesUnited KingdomUnited StatesUpper middle incomeUruguayUzbekistanVanuatuVenezuela, RBVietnamVirgin Islands (U.S.)West Bank and GazaWorldYemen, Rep.ZambiaZimbabwe Timeline:
This timeline shows a graph from 1961 to 2016 of Vanuatu. No data until 1960. Number of actual observations by date: 56.
Source name:
World Development Indicators
Source organization:
World Bank staff estimates based on age distributions of United Nations Population Division's World Population Prospects.
Categories, topics:
Education, Health
Last updated:
apr 23, 2017
Indicators value changes by year
Minimum:
51.218
jan 1, 1963
At the date of observation
Value
Absolute change
Change from previous value
jan 1, 1961
51.34
+51.34
0.0%
jan 1, 1962
51.249
-0.09
-0.18%
jan 1, 1963
51.218
-0.031
-0.06%
jan 1, 1964
51.234
+0.015
0.03%
jan 1, 1965
51.294
+0.061
0.12%
jan 1, 1966
51.418
+0.124
0.24%
jan 1, 1967
51.413
-0.005
-0.01%
jan 1, 1968
51.446
+0.032
0.06%
jan 1, 1969
51.52
+0.075
0.15%
jan 1, 1970
51.625
+0.104
0.2%
jan 1, 1971
51.734
+0.11
0.21%
jan 1, 1972
51.777
+0.043
0.08%
jan 1, 1973
51.84
+0.062
0.12%
jan 1, 1974
51.901
+0.061
0.12%
jan 1, 1975
51.975
+0.074
0.14%
jan 1, 1976
52.079
+0.104
0.2%
jan 1, 1977
52.129
+0.05
0.1%
jan 1, 1978
52.223
+0.095
0.18%
jan 1, 1979
52.326
+0.103
0.2%
jan 1, 1980
52.414
+0.088
0.17%
jan 1, 1981
52.49
+0.076
0.14%
jan 1, 1982
52.59
+0.1
0.19%
jan 1, 1983
52.618
+0.028
0.05%
jan 1, 1984
52.575
-0.043
-0.08%
jan 1, 1985
52.485
-0.091
-0.17%
jan 1, 1986
52.374
-0.111
-0.21%
jan 1, 1987
52.529
+0.154
0.29%
jan 1, 1988
52.629
+0.101
0.19%
jan 1, 1989
52.659
+0.029
0.06%
jan 1, 1990
52.631
-0.027
-0.05%
jan 1, 1991
52.571
-0.06
-0.11%
jan 1, 1992
52.848
+0.277
0.53%
jan 1, 1993
53.086
+0.238
0.45%
jan 1, 1994
53.301
+0.215
0.41%
jan 1, 1995
53.525
+0.224
0.42%
jan 1, 1996
53.785
+0.26
0.49%
jan 1, 1997
54.017
+0.232
0.43%
jan 1, 1998
54.303
+0.286
0.53%
jan 1, 1999
54.61
+0.308
0.57%
jan 1, 2000
54.906
+0.296
0.54%
jan 1, 2001
55.178
+0.272
0.5%
jan 1, 2002
55.557
+0.379
0.69%
jan 1, 2003
55.97
+0.412
0.74%
jan 1, 2004
56.376
+0.407
0.73%
jan 1, 2005
56.733
+0.357
0.63%
jan 1, 2006
57.028
+0.294
0.52%
jan 1, 2007
57.547
+0.519
0.91%
jan 1, 2008
57.784
+0.237
0.41%
jan 1, 2009
57.801
+0.017
0.03%
jan 1, 2010
57.776
-0.025
-0.04%
jan 1, 2011
57.852
+0.076
0.13%
jan 1, 2012
57.963
+0.111
0.19%
jan 1, 2013
58.335
+0.372
0.64%
jan 1, 2014
58.784
+0.449
0.77%
jan 1, 2015
59.113
+0.329
0.56%
jan 1, 2016
59.27
+0.157
0.27%
Ranking of countries by current statistics by years


Comments: