29
/
en
AIzaSyAYiBZKx7MnpbEhh9jyipgxe19OcubqV5w
April 1, 2024
140895
Ghana
GHA
true
2
1
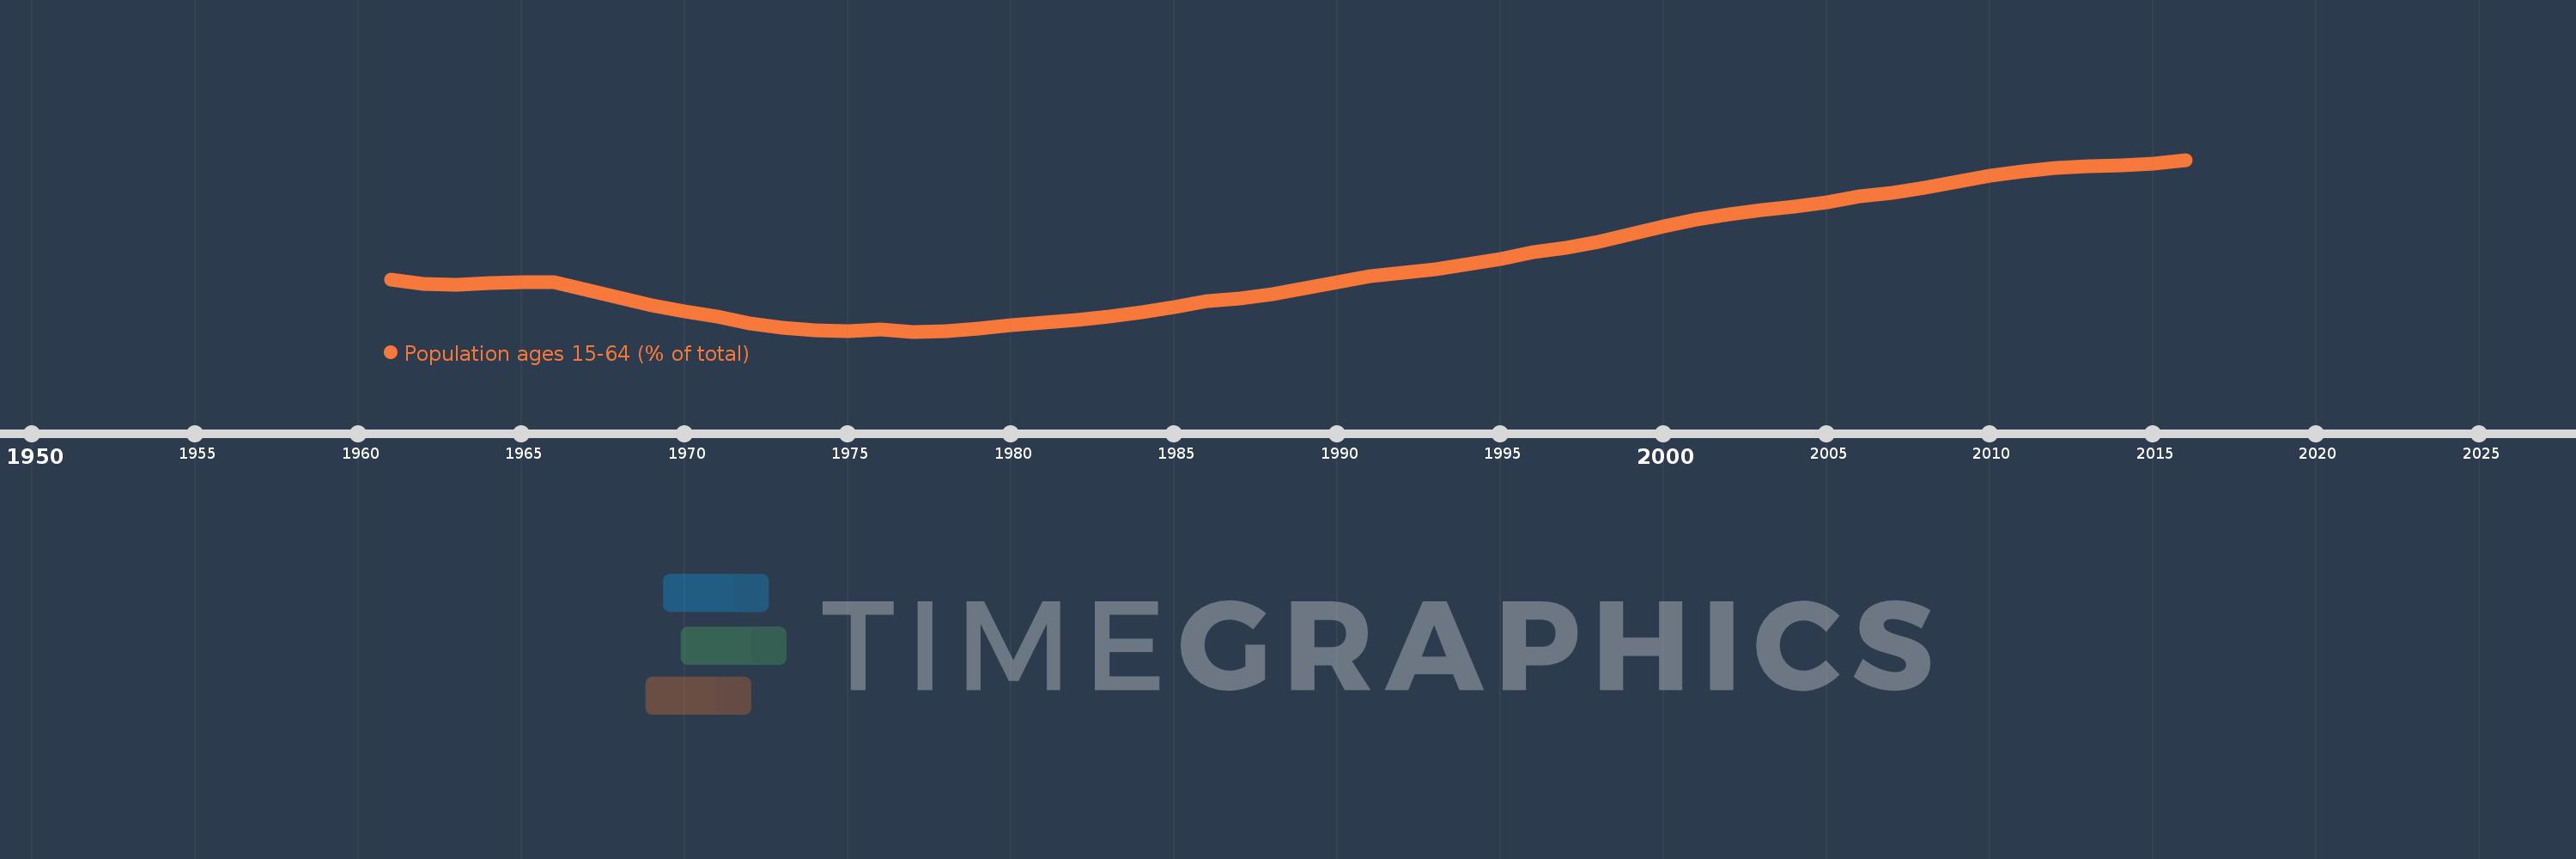
Population ages 15-64 (% of total)
2016,2015,2014,2013,2012,2011,2010,2009,2008,2007,2006,2005,2004,2003,2002,2001,2000,1999,1998,1997,1996,1995,1994,1993,1992,1991,1990,1989,1988,1987,1986,1985,1984,1983,1982,1981,1980,1979,1978,1977,1976,1975,1974,1973,1972,1971,1970,1969,1968,1967,1966,1965,1964,1963,1962,1961
This statistics in other country:
AfghanistanAlbaniaAlgeriaAngolaAntigua and BarbudaArab WorldArgentinaArmeniaArubaAustraliaAustriaAzerbaijanBahamas, TheBahrainBangladeshBarbadosBelarusBelgiumBelizeBeninBhutanBoliviaBosnia and HerzegovinaBotswanaBrazilBrunei DarussalamBulgariaBurkina FasoBurundiCabo VerdeCambodiaCameroonCanadaCaribbean small statesCentral African RepublicCentral Europe and the BalticsChadChannel IslandsChileChinaColombiaComorosCongo, Dem. Rep.Congo, Rep.Costa RicaCote d'IvoireCroatiaCubaCuracaoCyprusCzech RepublicDenmarkDjiboutiDominican RepublicEarly-demographic dividendEast Asia & PacificEast Asia & Pacific (excluding high income)East Asia & Pacific (IDA & IBRD countries)EcuadorEgypt, Arab Rep.El SalvadorEquatorial GuineaEritreaEstoniaEthiopiaEuro areaEurope & Central AsiaEurope & Central Asia (excluding high income)Europe & Central Asia (IDA & IBRD countries)European UnionFijiFinlandFragile and conflict affected situationsFranceFrench PolynesiaGabonGambia, TheGeorgiaGermanyGhanaGreeceGrenadaGuamGuatemalaGuineaGuinea-BissauGuyanaHaitiHeavily indebted poor countries (HIPC)High incomeHondurasHong Kong SAR, ChinaHungaryIBRD onlyIcelandIDA & IBRD totalIDA blendIDA onlyIDA totalIndiaIndonesiaIran, Islamic Rep.IraqIrelandIsraelItalyJamaicaJapanJordanKazakhstanKenyaKiribatiKorea, Dem. People’s Rep.Korea, Rep.KosovoKuwaitKyrgyz RepublicLao PDRLate-demographic dividendLatin America & Caribbean Latin America & Caribbean (excluding high income)Latin America & the Caribbean (IDA & IBRD countries)LatviaLeast developed countries: UN classificationLebanonLesothoLiberiaLibyaLithuaniaLow & middle incomeLow incomeLower middle incomeLuxembourgMacao SAR, ChinaMacedonia, FYRMadagascarMalawiMalaysiaMaldivesMaliMaltaMauritaniaMauritiusMexicoMicronesia, Fed. Sts.Middle East & North AfricaMiddle East & North Africa (excluding high income)Middle East & North Africa (IDA & IBRD countries)Middle incomeMoldovaMongoliaMontenegroMoroccoMozambiqueMyanmarNamibiaNepalNetherlandsNew CaledoniaNew ZealandNicaraguaNigerNigeriaNorth AmericaNorwayOECD membersOmanOther small statesPacific island small statesPakistanPanamaPapua New GuineaParaguayPeruPhilippinesPolandPortugalPost-demographic dividendPre-demographic dividendPuerto RicoQatarRomaniaRussian FederationRwandaSamoaSao Tome and PrincipeSaudi ArabiaSenegalSerbiaSeychellesSierra LeoneSingaporeSlovak RepublicSloveniaSmall statesSolomon IslandsSomaliaSouth AfricaSouth AsiaSouth Asia (IDA & IBRD)South SudanSpainSri LankaSt. LuciaSt. Vincent and the GrenadinesSub-Saharan Africa Sub-Saharan Africa (excluding high income)Sub-Saharan Africa (IDA & IBRD countries)SudanSurinameSwazilandSwedenSwitzerlandSyrian Arab RepublicTajikistanTanzaniaThailandTimor-LesteTogoTongaTrinidad and TobagoTunisiaTurkeyTurkmenistanUgandaUkraineUnited Arab EmiratesUnited KingdomUnited StatesUpper middle incomeUruguayUzbekistanVanuatuVenezuela, RBVietnamVirgin Islands (U.S.)West Bank and GazaWorldYemen, Rep.ZambiaZimbabwe Timeline:
This timeline shows a graph from 1961 to 2016 of Ghana. No data until 1960. Number of actual observations by date: 56.
Source name:
World Development Indicators
Source organization:
World Bank staff estimates based on age distributions of United Nations Population Division's World Population Prospects.
Categories, topics:
Education, Health
Last updated:
apr 23, 2017
Indicators value changes by year
Minimum:
51.328
jan 1, 1977
Maximum:
57.789
jan 1, 2016
At the date of observation
Value
Absolute change
Change from previous value
jan 1, 1961
53.28
+53.28
0.0%
jan 1, 1962
53.109
-0.171
-0.32%
jan 1, 1963
53.096
-0.013
-0.02%
jan 1, 1964
53.161
+0.065
0.12%
jan 1, 1965
53.198
+0.037
0.07%
jan 1, 1966
53.173
-0.024
-0.05%
jan 1, 1967
52.906
-0.268
-0.5%
jan 1, 1968
52.612
-0.294
-0.55%
jan 1, 1969
52.324
-0.289
-0.55%
jan 1, 1970
52.084
-0.24
-0.46%
jan 1, 1971
51.904
-0.18
-0.34%
jan 1, 1972
51.638
-0.266
-0.51%
jan 1, 1973
51.466
-0.173
-0.33%
jan 1, 1974
51.369
-0.097
-0.19%
jan 1, 1975
51.342
-0.027
-0.05%
jan 1, 1976
51.395
+0.053
0.1%
jan 1, 1977
51.328
-0.067
-0.13%
jan 1, 1978
51.342
+0.014
0.03%
jan 1, 1979
51.428
+0.086
0.17%
jan 1, 1980
51.556
+0.128
0.25%
jan 1, 1981
51.683
+0.127
0.25%
jan 1, 1982
51.757
+0.074
0.14%
jan 1, 1983
51.889
+0.132
0.26%
jan 1, 1984
52.054
+0.165
0.32%
jan 1, 1985
52.247
+0.193
0.37%
jan 1, 1986
52.474
+0.228
0.44%
jan 1, 1987
52.587
+0.113
0.21%
jan 1, 1988
52.747
+0.16
0.3%
jan 1, 1989
52.947
+0.2
0.38%
jan 1, 1990
53.175
+0.228
0.43%
jan 1, 1991
53.418
+0.243
0.46%
jan 1, 1992
53.531
+0.113
0.21%
jan 1, 1993
53.676
+0.145
0.27%
jan 1, 1994
53.85
+0.174
0.32%
jan 1, 1995
54.061
+0.211
0.39%
jan 1, 1996
54.315
+0.254
0.47%
jan 1, 1997
54.482
+0.167
0.31%
jan 1, 1998
54.712
+0.23
0.42%
jan 1, 1999
54.985
+0.274
0.5%
jan 1, 2000
55.272
+0.287
0.52%
jan 1, 2001
55.551
+0.278
0.5%
jan 1, 2002
55.731
+0.18
0.32%
jan 1, 2003
55.887
+0.156
0.28%
jan 1, 2004
56.035
+0.148
0.26%
jan 1, 2005
56.204
+0.169
0.3%
jan 1, 2006
56.406
+0.203
0.36%
jan 1, 2007
56.53
+0.124
0.22%
jan 1, 2008
56.726
+0.196
0.35%
jan 1, 2009
56.964
+0.237
0.42%
jan 1, 2010
57.188
+0.225
0.39%
jan 1, 2011
57.369
+0.181
0.32%
jan 1, 2012
57.491
+0.122
0.21%
jan 1, 2013
57.553
+0.063
0.11%
jan 1, 2014
57.591
+0.037
0.06%
jan 1, 2015
57.659
+0.068
0.12%
jan 1, 2016
57.789
+0.13
0.23%
Ranking of countries by current statistics by years


Comments: