29
/
en
AIzaSyAYiBZKx7MnpbEhh9jyipgxe19OcubqV5w
April 1, 2024
89033
Bosnia and Herzegovina
BIH
true
2
1
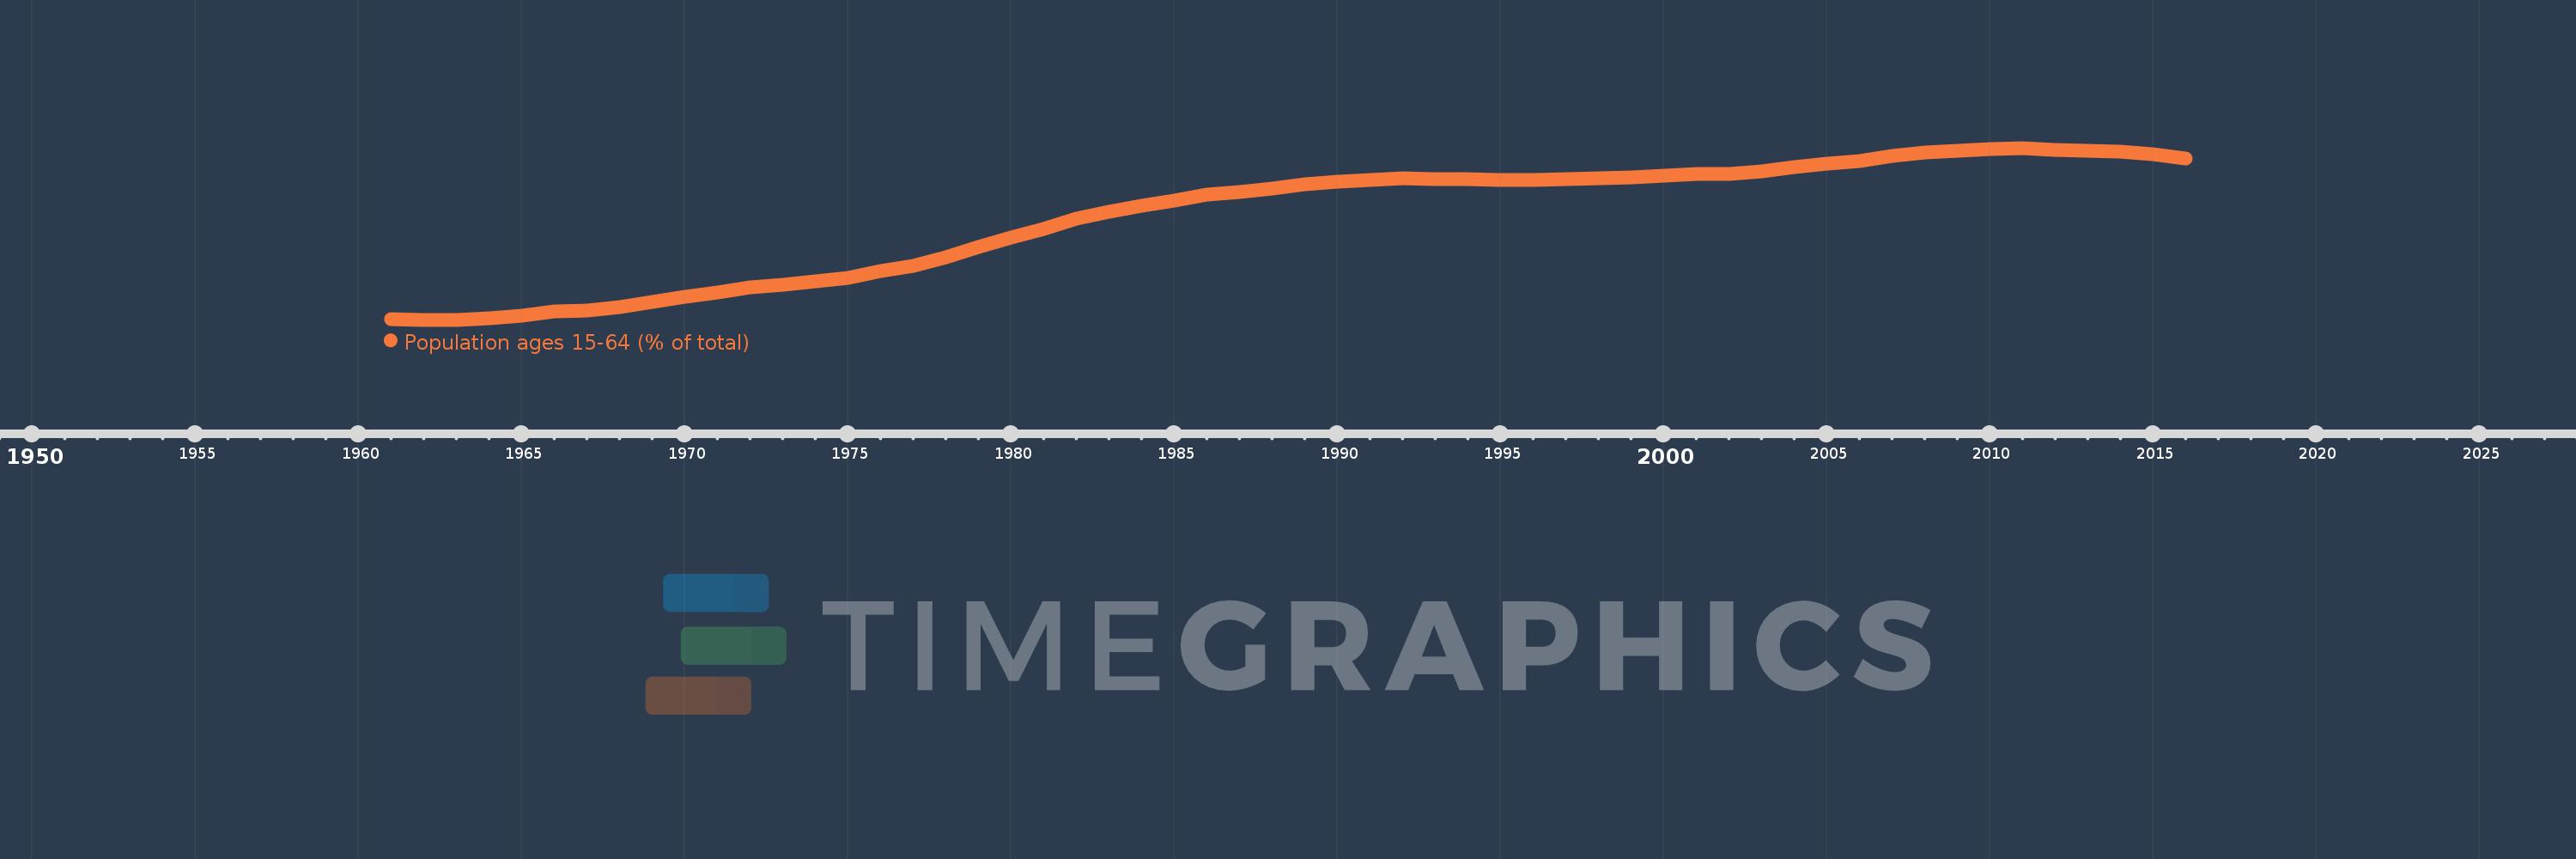
Population ages 15-64 (% of total)
2016,2015,2014,2013,2012,2011,2010,2009,2008,2007,2006,2005,2004,2003,2002,2001,2000,1999,1998,1997,1996,1995,1994,1993,1992,1991,1990,1989,1988,1987,1986,1985,1984,1983,1982,1981,1980,1979,1978,1977,1976,1975,1974,1973,1972,1971,1970,1969,1968,1967,1966,1965,1964,1963,1962,1961
This statistics in other country:
AfghanistanAlbaniaAlgeriaAngolaAntigua and BarbudaArab WorldArgentinaArmeniaArubaAustraliaAustriaAzerbaijanBahamas, TheBahrainBangladeshBarbadosBelarusBelgiumBelizeBeninBhutanBoliviaBosnia and HerzegovinaBotswanaBrazilBrunei DarussalamBulgariaBurkina FasoBurundiCabo VerdeCambodiaCameroonCanadaCaribbean small statesCentral African RepublicCentral Europe and the BalticsChadChannel IslandsChileChinaColombiaComorosCongo, Dem. Rep.Congo, Rep.Costa RicaCote d'IvoireCroatiaCubaCuracaoCyprusCzech RepublicDenmarkDjiboutiDominican RepublicEarly-demographic dividendEast Asia & PacificEast Asia & Pacific (excluding high income)East Asia & Pacific (IDA & IBRD countries)EcuadorEgypt, Arab Rep.El SalvadorEquatorial GuineaEritreaEstoniaEthiopiaEuro areaEurope & Central AsiaEurope & Central Asia (excluding high income)Europe & Central Asia (IDA & IBRD countries)European UnionFijiFinlandFragile and conflict affected situationsFranceFrench PolynesiaGabonGambia, TheGeorgiaGermanyGhanaGreeceGrenadaGuamGuatemalaGuineaGuinea-BissauGuyanaHaitiHeavily indebted poor countries (HIPC)High incomeHondurasHong Kong SAR, ChinaHungaryIBRD onlyIcelandIDA & IBRD totalIDA blendIDA onlyIDA totalIndiaIndonesiaIran, Islamic Rep.IraqIrelandIsraelItalyJamaicaJapanJordanKazakhstanKenyaKiribatiKorea, Dem. People’s Rep.Korea, Rep.KosovoKuwaitKyrgyz RepublicLao PDRLate-demographic dividendLatin America & Caribbean Latin America & Caribbean (excluding high income)Latin America & the Caribbean (IDA & IBRD countries)LatviaLeast developed countries: UN classificationLebanonLesothoLiberiaLibyaLithuaniaLow & middle incomeLow incomeLower middle incomeLuxembourgMacao SAR, ChinaMacedonia, FYRMadagascarMalawiMalaysiaMaldivesMaliMaltaMauritaniaMauritiusMexicoMicronesia, Fed. Sts.Middle East & North AfricaMiddle East & North Africa (excluding high income)Middle East & North Africa (IDA & IBRD countries)Middle incomeMoldovaMongoliaMontenegroMoroccoMozambiqueMyanmarNamibiaNepalNetherlandsNew CaledoniaNew ZealandNicaraguaNigerNigeriaNorth AmericaNorwayOECD membersOmanOther small statesPacific island small statesPakistanPanamaPapua New GuineaParaguayPeruPhilippinesPolandPortugalPost-demographic dividendPre-demographic dividendPuerto RicoQatarRomaniaRussian FederationRwandaSamoaSao Tome and PrincipeSaudi ArabiaSenegalSerbiaSeychellesSierra LeoneSingaporeSlovak RepublicSloveniaSmall statesSolomon IslandsSomaliaSouth AfricaSouth AsiaSouth Asia (IDA & IBRD)South SudanSpainSri LankaSt. LuciaSt. Vincent and the GrenadinesSub-Saharan Africa Sub-Saharan Africa (excluding high income)Sub-Saharan Africa (IDA & IBRD countries)SudanSurinameSwazilandSwedenSwitzerlandSyrian Arab RepublicTajikistanTanzaniaThailandTimor-LesteTogoTongaTrinidad and TobagoTunisiaTurkeyTurkmenistanUgandaUkraineUnited Arab EmiratesUnited KingdomUnited StatesUpper middle incomeUruguayUzbekistanVanuatuVenezuela, RBVietnamVirgin Islands (U.S.)West Bank and GazaWorldYemen, Rep.ZambiaZimbabwe Timeline:
This timeline shows a graph from 1961 to 2016 of Bosnia and Herzegovina. No data until 1960. Number of actual observations by date: 56.
Source name:
World Development Indicators
Source organization:
World Bank staff estimates based on age distributions of United Nations Population Division's World Population Prospects.
Categories, topics:
Education, Health
Last updated:
apr 23, 2017
Indicators value changes by year
Minimum:
58.692
jan 1, 1962
Maximum:
71.844
jan 1, 2011
At the date of observation
Value
Absolute change
Change from previous value
jan 1, 1961
58.77
+58.77
0.0%
jan 1, 1962
58.692
-0.078
-0.13%
jan 1, 1963
58.694
+0.002
0.0%
jan 1, 1964
58.798
+0.104
0.18%
jan 1, 1965
59.002
+0.204
0.35%
jan 1, 1966
59.299
+0.297
0.5%
jan 1, 1967
59.389
+0.09
0.15%
jan 1, 1968
59.679
+0.29
0.49%
jan 1, 1969
60.079
+0.4
0.67%
jan 1, 1970
60.459
+0.38
0.63%
jan 1, 1971
60.758
+0.298
0.49%
jan 1, 1972
61.154
+0.396
0.65%
jan 1, 1973
61.401
+0.248
0.4%
jan 1, 1974
61.6
+0.198
0.32%
jan 1, 1975
61.906
+0.307
0.5%
jan 1, 1976
62.394
+0.488
0.79%
jan 1, 1977
62.834
+0.439
0.7%
jan 1, 1978
63.485
+0.651
1.04%
jan 1, 1979
64.263
+0.778
1.23%
jan 1, 1980
65.018
+0.755
1.17%
jan 1, 1981
65.663
+0.645
0.99%
jan 1, 1982
66.406
+0.743
1.13%
jan 1, 1983
66.962
+0.555
0.84%
jan 1, 1984
67.392
+0.431
0.64%
jan 1, 1985
67.814
+0.422
0.63%
jan 1, 1986
68.275
+0.461
0.68%
jan 1, 1987
68.464
+0.188
0.28%
jan 1, 1988
68.746
+0.282
0.41%
jan 1, 1989
69.046
+0.3
0.44%
jan 1, 1990
69.264
+0.219
0.32%
jan 1, 1991
69.396
+0.132
0.19%
jan 1, 1992
69.497
+0.101
0.15%
jan 1, 1993
69.483
-0.014
-0.02%
jan 1, 1994
69.426
-0.057
-0.08%
jan 1, 1995
69.393
-0.032
-0.05%
jan 1, 1996
69.38
-0.013
-0.02%
jan 1, 1997
69.465
+0.085
0.12%
jan 1, 1998
69.534
+0.069
0.1%
jan 1, 1999
69.603
+0.069
0.1%
jan 1, 2000
69.703
+0.101
0.14%
jan 1, 2001
69.857
+0.154
0.22%
jan 1, 2002
69.873
+0.016
0.02%
jan 1, 2003
70.063
+0.19
0.27%
jan 1, 2004
70.349
+0.286
0.41%
jan 1, 2005
70.623
+0.274
0.39%
jan 1, 2006
70.837
+0.214
0.3%
jan 1, 2007
71.259
+0.421
0.59%
jan 1, 2008
71.507
+0.248
0.35%
jan 1, 2009
71.634
+0.127
0.18%
jan 1, 2010
71.736
+0.102
0.14%
jan 1, 2011
71.844
+0.108
0.15%
jan 1, 2012
71.687
-0.157
-0.22%
jan 1, 2013
71.613
-0.074
-0.1%
jan 1, 2014
71.552
-0.062
-0.09%
jan 1, 2015
71.383
-0.169
-0.24%
jan 1, 2016
71.058
-0.325
-0.46%
Ranking of countries by current statistics by years


Comments: