29
/
en
AIzaSyAYiBZKx7MnpbEhh9jyipgxe19OcubqV5w
April 1, 2024
112762
Costa Rica
CRI
true
2
1
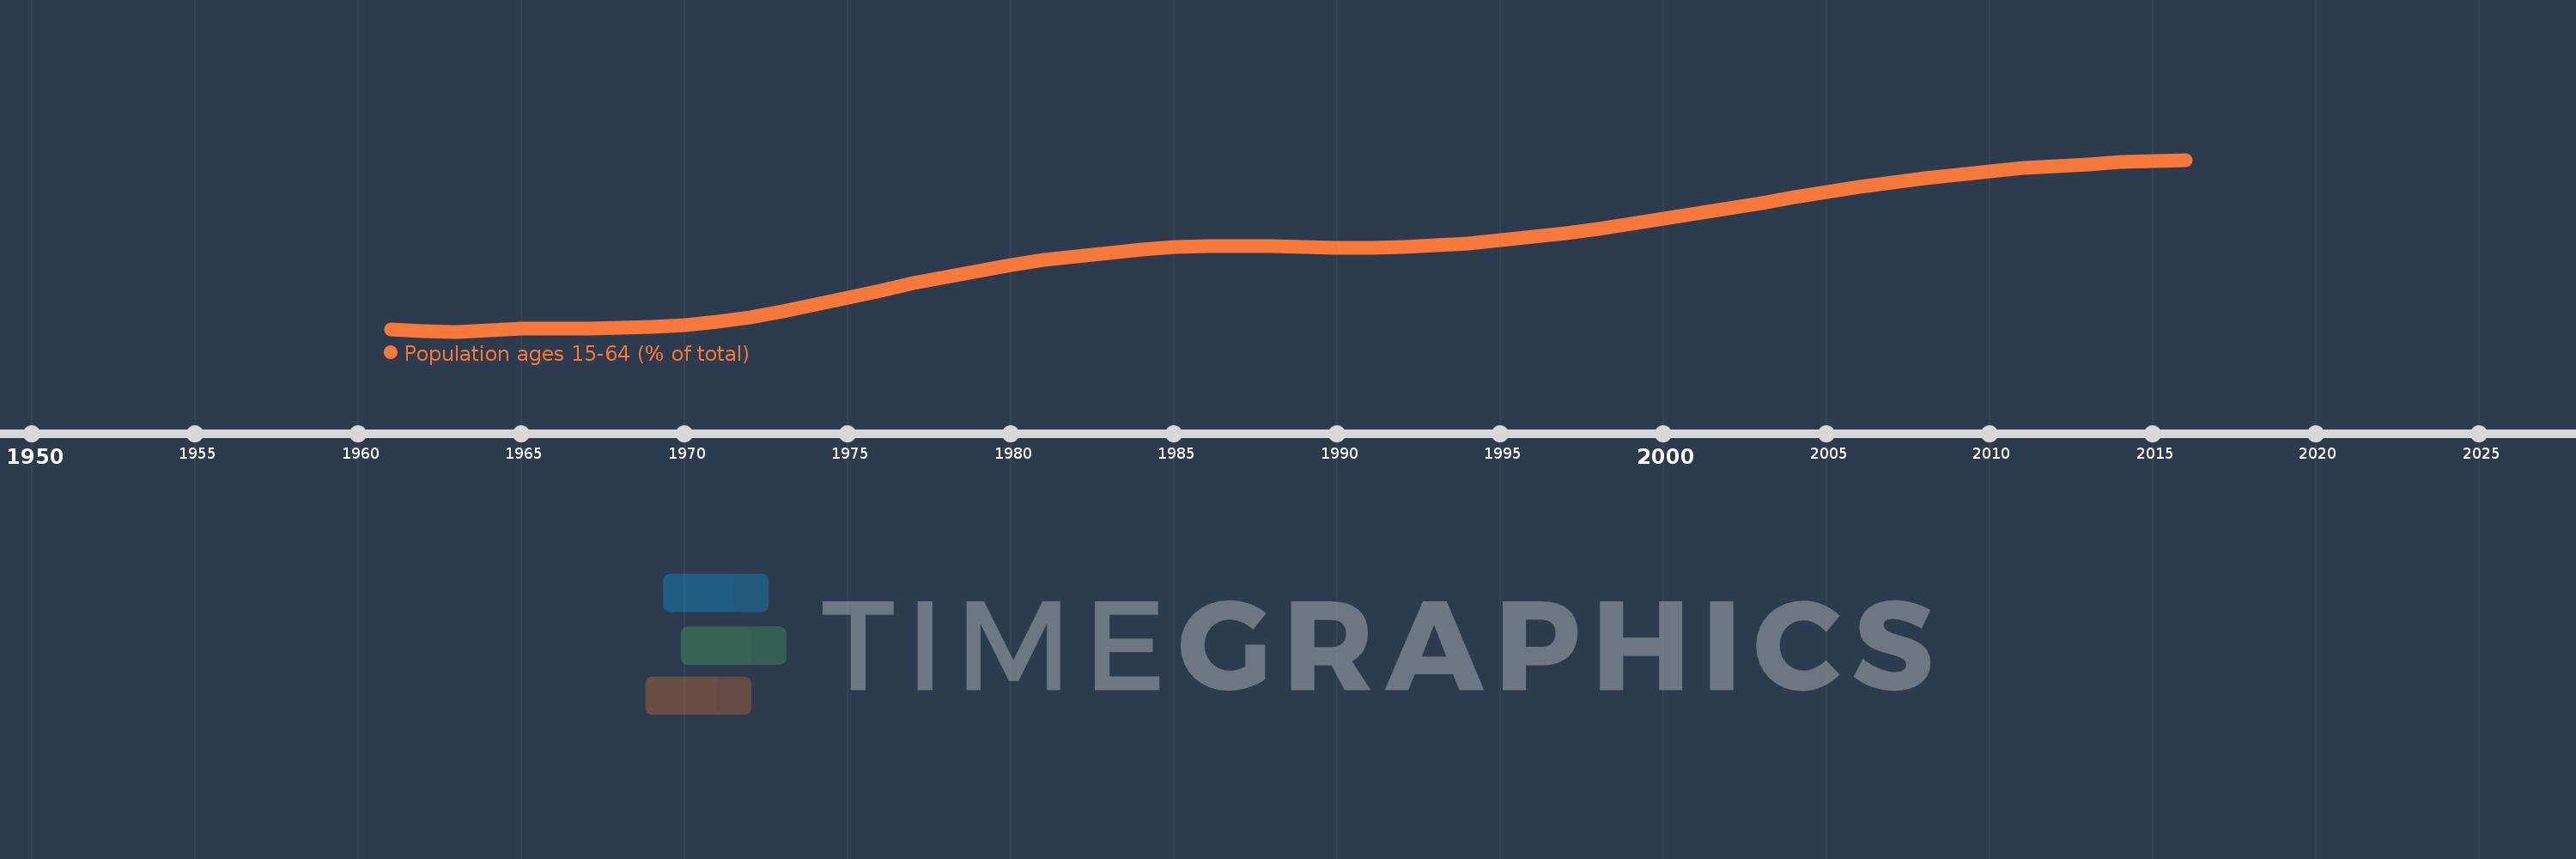
Population ages 15-64 (% of total)
2016,2015,2014,2013,2012,2011,2010,2009,2008,2007,2006,2005,2004,2003,2002,2001,2000,1999,1998,1997,1996,1995,1994,1993,1992,1991,1990,1989,1988,1987,1986,1985,1984,1983,1982,1981,1980,1979,1978,1977,1976,1975,1974,1973,1972,1971,1970,1969,1968,1967,1966,1965,1964,1963,1962,1961
This statistics in other country:
AfghanistanAlbaniaAlgeriaAngolaAntigua and BarbudaArab WorldArgentinaArmeniaArubaAustraliaAustriaAzerbaijanBahamas, TheBahrainBangladeshBarbadosBelarusBelgiumBelizeBeninBhutanBoliviaBosnia and HerzegovinaBotswanaBrazilBrunei DarussalamBulgariaBurkina FasoBurundiCabo VerdeCambodiaCameroonCanadaCaribbean small statesCentral African RepublicCentral Europe and the BalticsChadChannel IslandsChileChinaColombiaComorosCongo, Dem. Rep.Congo, Rep.Costa RicaCote d'IvoireCroatiaCubaCuracaoCyprusCzech RepublicDenmarkDjiboutiDominican RepublicEarly-demographic dividendEast Asia & PacificEast Asia & Pacific (excluding high income)East Asia & Pacific (IDA & IBRD countries)EcuadorEgypt, Arab Rep.El SalvadorEquatorial GuineaEritreaEstoniaEthiopiaEuro areaEurope & Central AsiaEurope & Central Asia (excluding high income)Europe & Central Asia (IDA & IBRD countries)European UnionFijiFinlandFragile and conflict affected situationsFranceFrench PolynesiaGabonGambia, TheGeorgiaGermanyGhanaGreeceGrenadaGuamGuatemalaGuineaGuinea-BissauGuyanaHaitiHeavily indebted poor countries (HIPC)High incomeHondurasHong Kong SAR, ChinaHungaryIBRD onlyIcelandIDA & IBRD totalIDA blendIDA onlyIDA totalIndiaIndonesiaIran, Islamic Rep.IraqIrelandIsraelItalyJamaicaJapanJordanKazakhstanKenyaKiribatiKorea, Dem. People’s Rep.Korea, Rep.KosovoKuwaitKyrgyz RepublicLao PDRLate-demographic dividendLatin America & Caribbean Latin America & Caribbean (excluding high income)Latin America & the Caribbean (IDA & IBRD countries)LatviaLeast developed countries: UN classificationLebanonLesothoLiberiaLibyaLithuaniaLow & middle incomeLow incomeLower middle incomeLuxembourgMacao SAR, ChinaMacedonia, FYRMadagascarMalawiMalaysiaMaldivesMaliMaltaMauritaniaMauritiusMexicoMicronesia, Fed. Sts.Middle East & North AfricaMiddle East & North Africa (excluding high income)Middle East & North Africa (IDA & IBRD countries)Middle incomeMoldovaMongoliaMontenegroMoroccoMozambiqueMyanmarNamibiaNepalNetherlandsNew CaledoniaNew ZealandNicaraguaNigerNigeriaNorth AmericaNorwayOECD membersOmanOther small statesPacific island small statesPakistanPanamaPapua New GuineaParaguayPeruPhilippinesPolandPortugalPost-demographic dividendPre-demographic dividendPuerto RicoQatarRomaniaRussian FederationRwandaSamoaSao Tome and PrincipeSaudi ArabiaSenegalSerbiaSeychellesSierra LeoneSingaporeSlovak RepublicSloveniaSmall statesSolomon IslandsSomaliaSouth AfricaSouth AsiaSouth Asia (IDA & IBRD)South SudanSpainSri LankaSt. LuciaSt. Vincent and the GrenadinesSub-Saharan Africa Sub-Saharan Africa (excluding high income)Sub-Saharan Africa (IDA & IBRD countries)SudanSurinameSwazilandSwedenSwitzerlandSyrian Arab RepublicTajikistanTanzaniaThailandTimor-LesteTogoTongaTrinidad and TobagoTunisiaTurkeyTurkmenistanUgandaUkraineUnited Arab EmiratesUnited KingdomUnited StatesUpper middle incomeUruguayUzbekistanVanuatuVenezuela, RBVietnamVirgin Islands (U.S.)West Bank and GazaWorldYemen, Rep.ZambiaZimbabwe Timeline:
This timeline shows a graph from 1961 to 2016 of Costa Rica. No data until 1960. Number of actual observations by date: 56.
Source name:
World Development Indicators
Source organization:
World Bank staff estimates based on age distributions of United Nations Population Division's World Population Prospects.
Categories, topics:
Education, Health
Last updated:
apr 23, 2017
Indicators value changes by year
Minimum:
52.013
jan 1, 1963
At the date of observation
Value
Absolute change
Change from previous value
jan 1, 1961
52.257
+52.257
0.0%
jan 1, 1962
52.016
-0.241
-0.46%
jan 1, 1963
52.013
-0.003
-0.01%
jan 1, 1964
52.141
+0.128
0.25%
jan 1, 1965
52.267
+0.126
0.24%
jan 1, 1966
52.345
+0.078
0.15%
jan 1, 1967
52.346
+0.001
0.0%
jan 1, 1968
52.367
+0.021
0.04%
jan 1, 1969
52.437
+0.07
0.13%
jan 1, 1970
52.62
+0.183
0.35%
jan 1, 1971
52.952
+0.332
0.63%
jan 1, 1972
53.403
+0.451
0.85%
jan 1, 1973
53.972
+0.57
1.07%
jan 1, 1974
54.635
+0.663
1.23%
jan 1, 1975
55.334
+0.699
1.28%
jan 1, 1976
56.021
+0.687
1.24%
jan 1, 1977
56.74
+0.718
1.28%
jan 1, 1978
57.366
+0.627
1.1%
jan 1, 1979
57.932
+0.566
0.99%
jan 1, 1980
58.479
+0.547
0.94%
jan 1, 1981
59.014
+0.535
0.91%
jan 1, 1982
59.313
+0.298
0.51%
jan 1, 1983
59.666
+0.353
0.6%
jan 1, 1984
60.005
+0.34
0.57%
jan 1, 1985
60.249
+0.244
0.41%
jan 1, 1986
60.372
+0.123
0.2%
jan 1, 1987
60.399
+0.026
0.04%
jan 1, 1988
60.346
-0.053
-0.09%
jan 1, 1989
60.25
-0.095
-0.16%
jan 1, 1990
60.179
-0.071
-0.12%
jan 1, 1991
60.169
-0.01
-0.02%
jan 1, 1992
60.262
+0.093
0.15%
jan 1, 1993
60.423
+0.161
0.27%
jan 1, 1994
60.651
+0.228
0.38%
jan 1, 1995
60.937
+0.286
0.47%
jan 1, 1996
61.271
+0.334
0.55%
jan 1, 1997
61.634
+0.363
0.59%
jan 1, 1998
62.044
+0.41
0.67%
jan 1, 1999
62.501
+0.457
0.74%
jan 1, 2000
63.007
+0.506
0.81%
jan 1, 2001
63.559
+0.552
0.88%
jan 1, 2002
64.028
+0.47
0.74%
jan 1, 2003
64.553
+0.524
0.82%
jan 1, 2004
65.103
+0.55
0.85%
jan 1, 2005
65.637
+0.534
0.82%
jan 1, 2006
66.127
+0.49
0.75%
jan 1, 2007
66.606
+0.479
0.72%
jan 1, 2008
67.002
+0.397
0.6%
jan 1, 2009
67.339
+0.337
0.5%
jan 1, 2010
67.655
+0.316
0.47%
jan 1, 2011
67.963
+0.308
0.46%
jan 1, 2012
68.145
+0.182
0.27%
jan 1, 2013
68.35
+0.205
0.3%
jan 1, 2014
68.549
+0.199
0.29%
jan 1, 2015
68.701
+0.152
0.22%
jan 1, 2016
68.79
+0.089
0.13%
Ranking of countries by current statistics by years


Comments: