29
/
en
AIzaSyAYiBZKx7MnpbEhh9jyipgxe19OcubqV5w
April 1, 2024
225282
Poland
POL
true
2
1
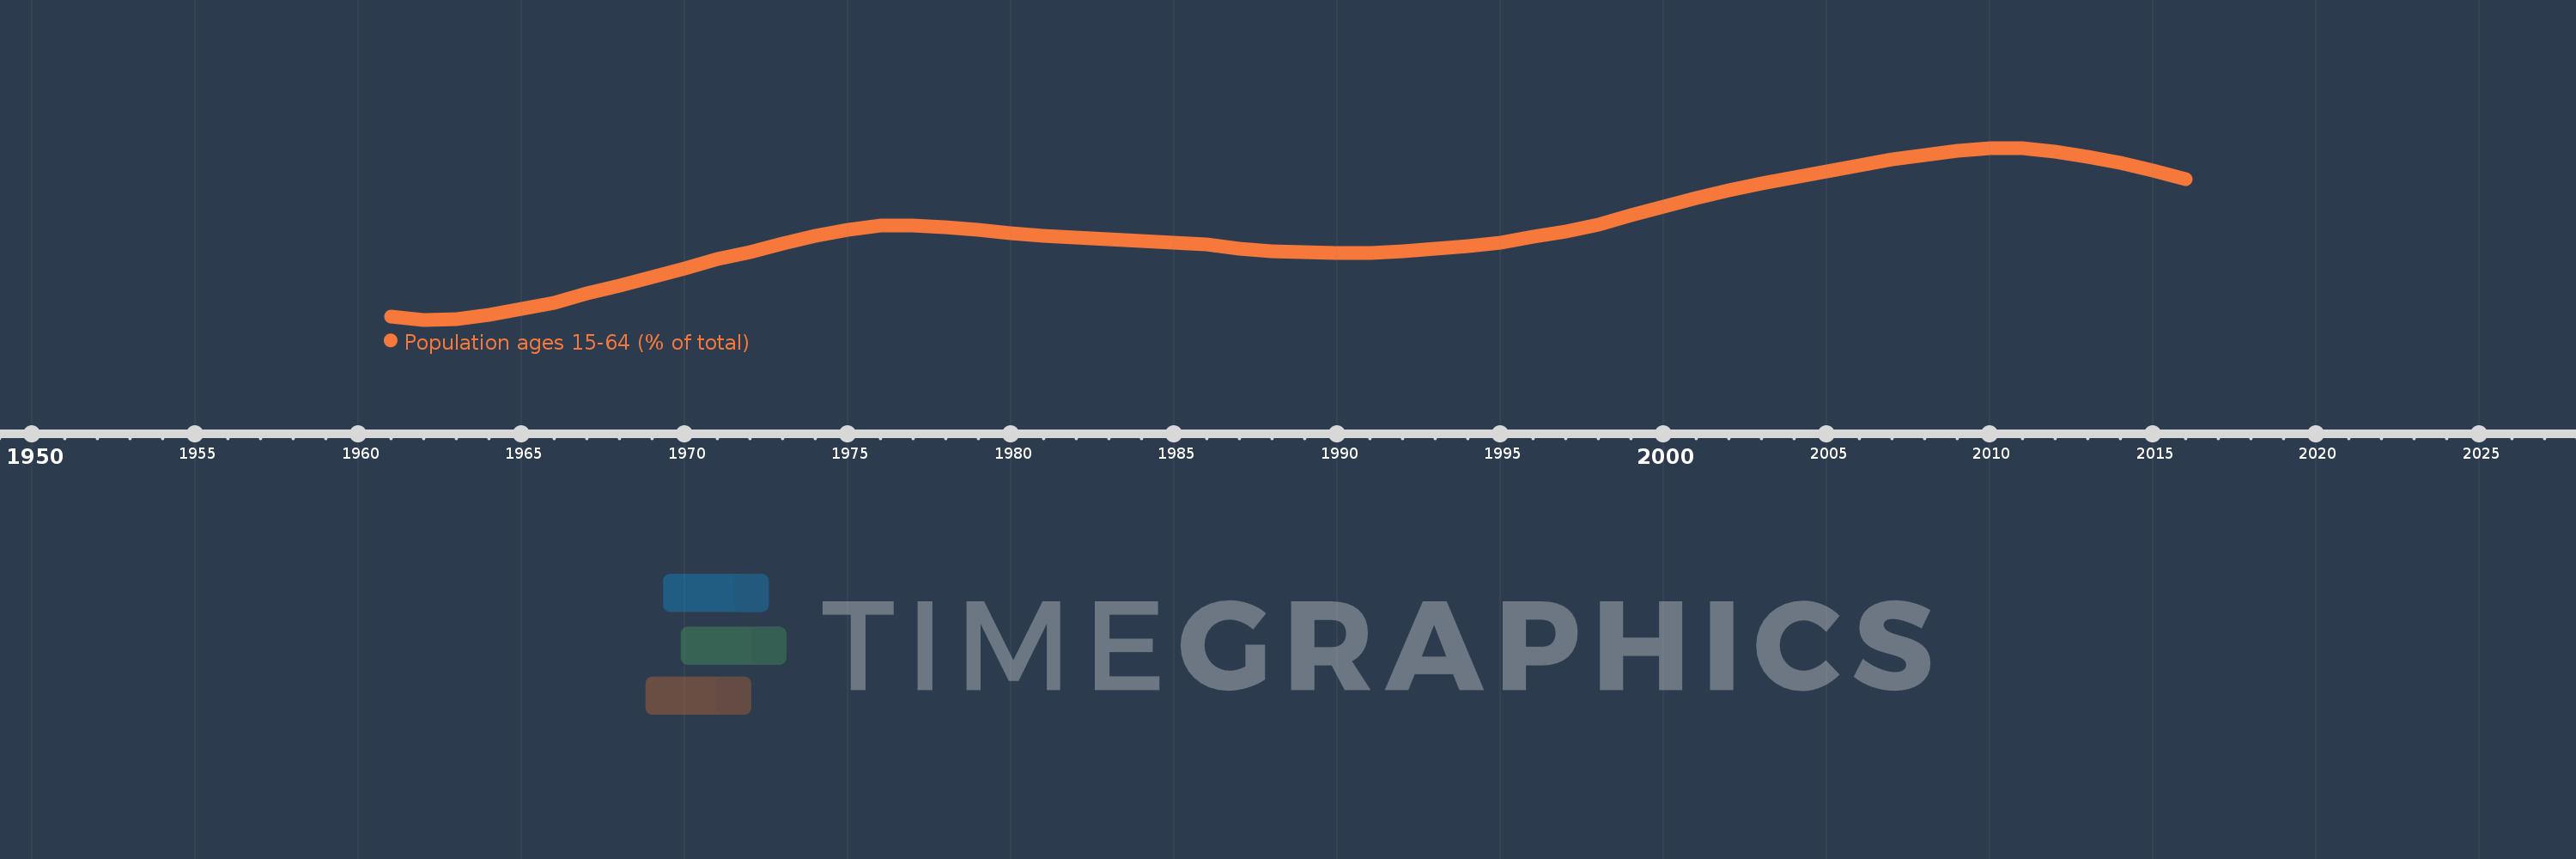
Population ages 15-64 (% of total)
2016,2015,2014,2013,2012,2011,2010,2009,2008,2007,2006,2005,2004,2003,2002,2001,2000,1999,1998,1997,1996,1995,1994,1993,1992,1991,1990,1989,1988,1987,1986,1985,1984,1983,1982,1981,1980,1979,1978,1977,1976,1975,1974,1973,1972,1971,1970,1969,1968,1967,1966,1965,1964,1963,1962,1961
This statistics in other country:
AfghanistanAlbaniaAlgeriaAngolaAntigua and BarbudaArab WorldArgentinaArmeniaArubaAustraliaAustriaAzerbaijanBahamas, TheBahrainBangladeshBarbadosBelarusBelgiumBelizeBeninBhutanBoliviaBosnia and HerzegovinaBotswanaBrazilBrunei DarussalamBulgariaBurkina FasoBurundiCabo VerdeCambodiaCameroonCanadaCaribbean small statesCentral African RepublicCentral Europe and the BalticsChadChannel IslandsChileChinaColombiaComorosCongo, Dem. Rep.Congo, Rep.Costa RicaCote d'IvoireCroatiaCubaCuracaoCyprusCzech RepublicDenmarkDjiboutiDominican RepublicEarly-demographic dividendEast Asia & PacificEast Asia & Pacific (excluding high income)East Asia & Pacific (IDA & IBRD countries)EcuadorEgypt, Arab Rep.El SalvadorEquatorial GuineaEritreaEstoniaEthiopiaEuro areaEurope & Central AsiaEurope & Central Asia (excluding high income)Europe & Central Asia (IDA & IBRD countries)European UnionFijiFinlandFragile and conflict affected situationsFranceFrench PolynesiaGabonGambia, TheGeorgiaGermanyGhanaGreeceGrenadaGuamGuatemalaGuineaGuinea-BissauGuyanaHaitiHeavily indebted poor countries (HIPC)High incomeHondurasHong Kong SAR, ChinaHungaryIBRD onlyIcelandIDA & IBRD totalIDA blendIDA onlyIDA totalIndiaIndonesiaIran, Islamic Rep.IraqIrelandIsraelItalyJamaicaJapanJordanKazakhstanKenyaKiribatiKorea, Dem. People’s Rep.Korea, Rep.KosovoKuwaitKyrgyz RepublicLao PDRLate-demographic dividendLatin America & Caribbean Latin America & Caribbean (excluding high income)Latin America & the Caribbean (IDA & IBRD countries)LatviaLeast developed countries: UN classificationLebanonLesothoLiberiaLibyaLithuaniaLow & middle incomeLow incomeLower middle incomeLuxembourgMacao SAR, ChinaMacedonia, FYRMadagascarMalawiMalaysiaMaldivesMaliMaltaMauritaniaMauritiusMexicoMicronesia, Fed. Sts.Middle East & North AfricaMiddle East & North Africa (excluding high income)Middle East & North Africa (IDA & IBRD countries)Middle incomeMoldovaMongoliaMontenegroMoroccoMozambiqueMyanmarNamibiaNepalNetherlandsNew CaledoniaNew ZealandNicaraguaNigerNigeriaNorth AmericaNorwayOECD membersOmanOther small statesPacific island small statesPakistanPanamaPapua New GuineaParaguayPeruPhilippinesPolandPortugalPost-demographic dividendPre-demographic dividendPuerto RicoQatarRomaniaRussian FederationRwandaSamoaSao Tome and PrincipeSaudi ArabiaSenegalSerbiaSeychellesSierra LeoneSingaporeSlovak RepublicSloveniaSmall statesSolomon IslandsSomaliaSouth AfricaSouth AsiaSouth Asia (IDA & IBRD)South SudanSpainSri LankaSt. LuciaSt. Vincent and the GrenadinesSub-Saharan Africa Sub-Saharan Africa (excluding high income)Sub-Saharan Africa (IDA & IBRD countries)SudanSurinameSwazilandSwedenSwitzerlandSyrian Arab RepublicTajikistanTanzaniaThailandTimor-LesteTogoTongaTrinidad and TobagoTunisiaTurkeyTurkmenistanUgandaUkraineUnited Arab EmiratesUnited KingdomUnited StatesUpper middle incomeUruguayUzbekistanVanuatuVenezuela, RBVietnamVirgin Islands (U.S.)West Bank and GazaWorldYemen, Rep.ZambiaZimbabwe Timeline:
This timeline shows a graph from 1961 to 2016 of Poland. No data until 1960. Number of actual observations by date: 56.
Source name:
World Development Indicators
Source organization:
World Bank staff estimates based on age distributions of United Nations Population Division's World Population Prospects.
Categories, topics:
Education, Health
Last updated:
apr 23, 2017
Indicators value changes by year
Minimum:
60.387
jan 1, 1962
Maximum:
71.549
jan 1, 2011
At the date of observation
Value
Absolute change
Change from previous value
jan 1, 1961
60.61
+60.61
0.0%
jan 1, 1962
60.387
-0.222
-0.37%
jan 1, 1963
60.444
+0.056
0.09%
jan 1, 1964
60.718
+0.275
0.45%
jan 1, 1965
61.087
+0.368
0.61%
jan 1, 1966
61.477
+0.391
0.64%
jan 1, 1967
62.084
+0.607
0.99%
jan 1, 1968
62.621
+0.537
0.86%
jan 1, 1969
63.141
+0.519
0.83%
jan 1, 1970
63.71
+0.57
0.9%
jan 1, 1971
64.337
+0.626
0.98%
jan 1, 1972
64.8
+0.463
0.72%
jan 1, 1973
65.319
+0.52
0.8%
jan 1, 1974
65.832
+0.513
0.78%
jan 1, 1975
66.238
+0.407
0.62%
jan 1, 1976
66.488
+0.249
0.38%
jan 1, 1977
66.491
+0.003
0.0%
jan 1, 1978
66.391
-0.1
-0.15%
jan 1, 1979
66.21
-0.181
-0.27%
jan 1, 1980
66.013
-0.197
-0.3%
jan 1, 1981
65.842
-0.17
-0.26%
jan 1, 1982
65.712
-0.13
-0.2%
jan 1, 1983
65.603
-0.108
-0.17%
jan 1, 1984
65.499
-0.104
-0.16%
jan 1, 1985
65.384
-0.115
-0.18%
jan 1, 1986
65.263
-0.121
-0.18%
jan 1, 1987
65.027
-0.237
-0.36%
jan 1, 1988
64.853
-0.173
-0.27%
jan 1, 1989
64.753
-0.1
-0.15%
jan 1, 1990
64.717
-0.036
-0.06%
jan 1, 1991
64.736
+0.019
0.03%
jan 1, 1992
64.861
+0.125
0.19%
jan 1, 1993
64.984
+0.123
0.19%
jan 1, 1994
65.146
+0.162
0.25%
jan 1, 1995
65.408
+0.262
0.4%
jan 1, 1996
65.798
+0.39
0.6%
jan 1, 1997
66.119
+0.32
0.49%
jan 1, 1998
66.589
+0.471
0.71%
jan 1, 1999
67.161
+0.572
0.86%
jan 1, 2000
67.745
+0.584
0.87%
jan 1, 2001
68.287
+0.541
0.8%
jan 1, 2002
68.8
+0.513
0.75%
jan 1, 2003
69.243
+0.443
0.64%
jan 1, 2004
69.636
+0.393
0.57%
jan 1, 2005
70.028
+0.392
0.56%
jan 1, 2006
70.436
+0.408
0.58%
jan 1, 2007
70.785
+0.349
0.49%
jan 1, 2008
71.105
+0.32
0.45%
jan 1, 2009
71.366
+0.261
0.37%
jan 1, 2010
71.524
+0.157
0.22%
jan 1, 2011
71.549
+0.025
0.03%
jan 1, 2012
71.282
-0.266
-0.37%
jan 1, 2013
70.97
-0.312
-0.44%
jan 1, 2014
70.584
-0.386
-0.54%
jan 1, 2015
70.098
-0.486
-0.69%
jan 1, 2016
69.52
-0.578
-0.82%
Ranking of countries by current statistics by years


Comments: