29
/
en
AIzaSyAYiBZKx7MnpbEhh9jyipgxe19OcubqV5w
April 1, 2024
79852
Barbados
BRB
true
2
1
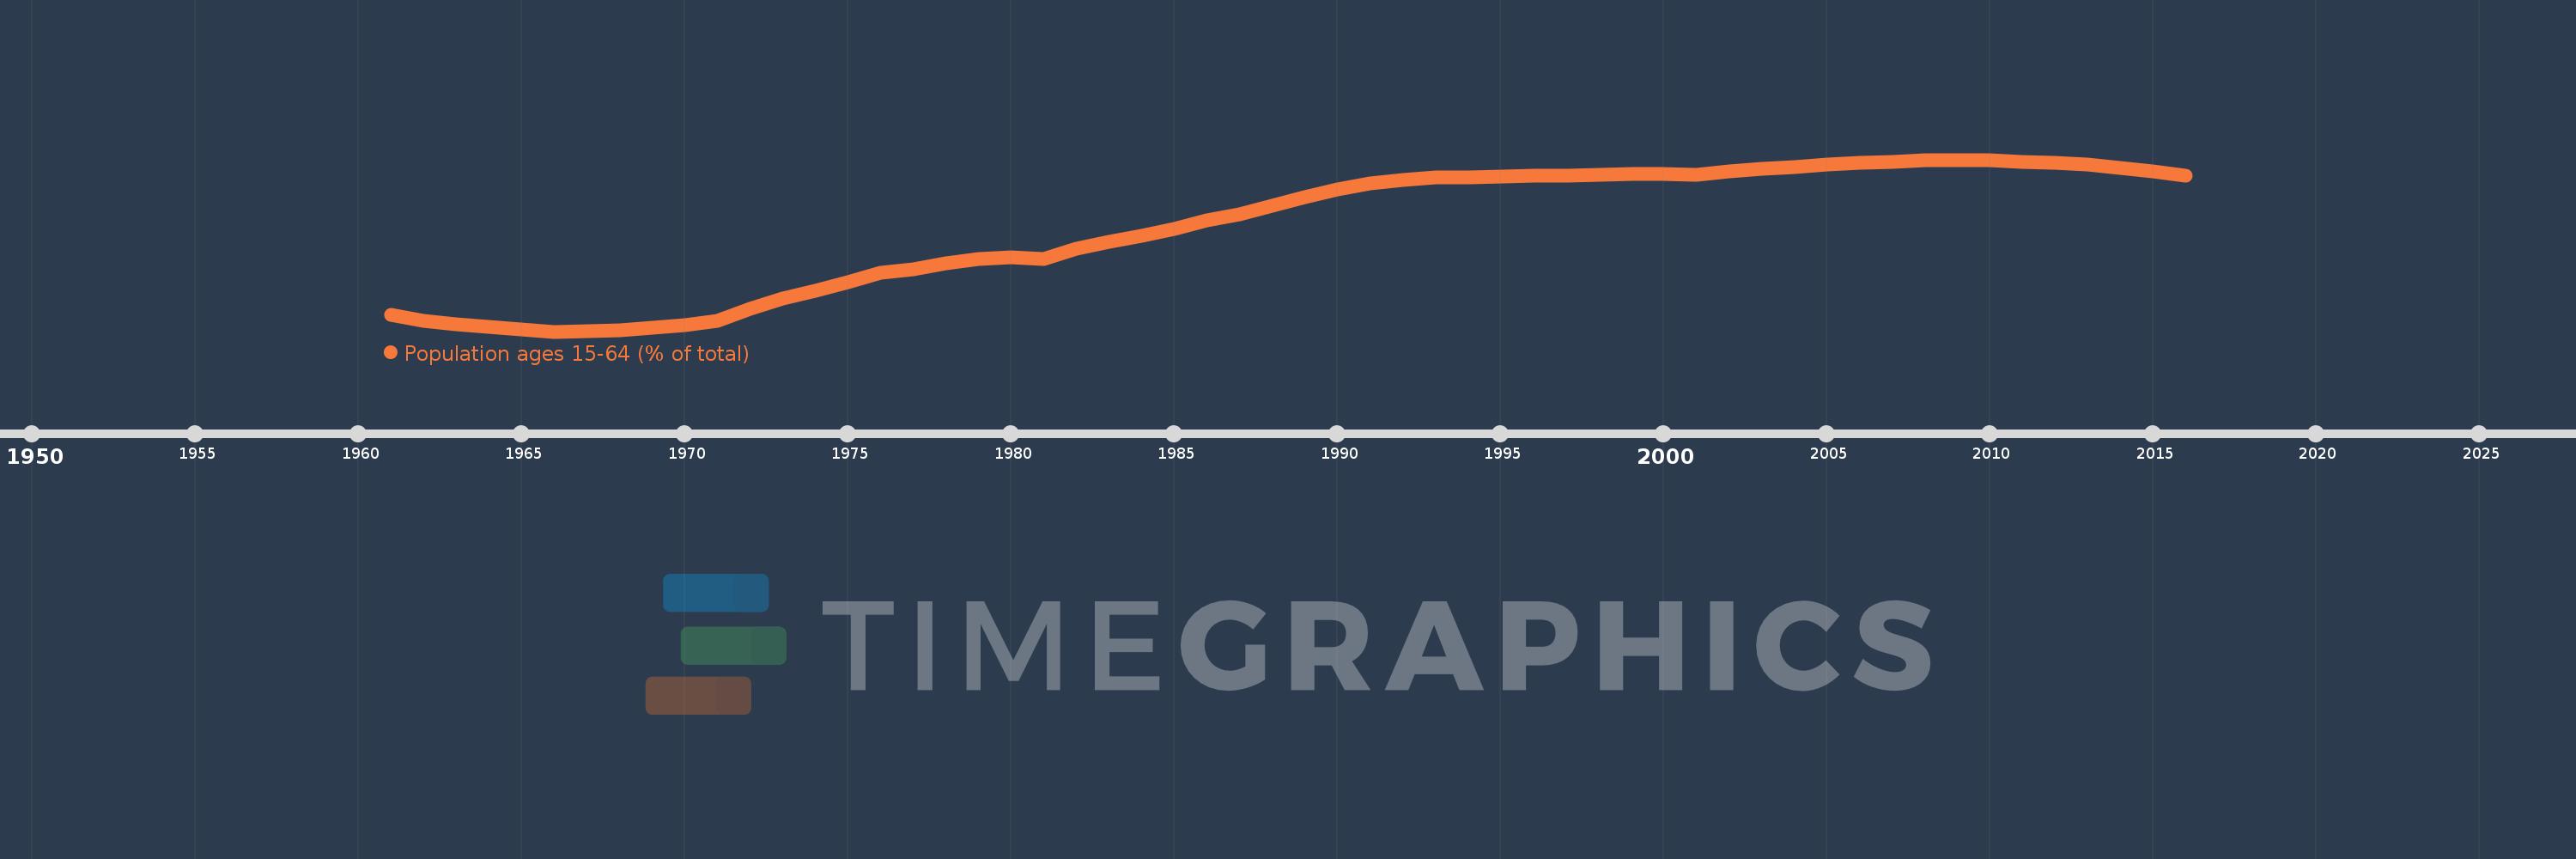
Population ages 15-64 (% of total)
2016,2015,2014,2013,2012,2011,2010,2009,2008,2007,2006,2005,2004,2003,2002,2001,2000,1999,1998,1997,1996,1995,1994,1993,1992,1991,1990,1989,1988,1987,1986,1985,1984,1983,1982,1981,1980,1979,1978,1977,1976,1975,1974,1973,1972,1971,1970,1969,1968,1967,1966,1965,1964,1963,1962,1961
This statistics in other country:
AfghanistanAlbaniaAlgeriaAngolaAntigua and BarbudaArab WorldArgentinaArmeniaArubaAustraliaAustriaAzerbaijanBahamas, TheBahrainBangladeshBarbadosBelarusBelgiumBelizeBeninBhutanBoliviaBosnia and HerzegovinaBotswanaBrazilBrunei DarussalamBulgariaBurkina FasoBurundiCabo VerdeCambodiaCameroonCanadaCaribbean small statesCentral African RepublicCentral Europe and the BalticsChadChannel IslandsChileChinaColombiaComorosCongo, Dem. Rep.Congo, Rep.Costa RicaCote d'IvoireCroatiaCubaCuracaoCyprusCzech RepublicDenmarkDjiboutiDominican RepublicEarly-demographic dividendEast Asia & PacificEast Asia & Pacific (excluding high income)East Asia & Pacific (IDA & IBRD countries)EcuadorEgypt, Arab Rep.El SalvadorEquatorial GuineaEritreaEstoniaEthiopiaEuro areaEurope & Central AsiaEurope & Central Asia (excluding high income)Europe & Central Asia (IDA & IBRD countries)European UnionFijiFinlandFragile and conflict affected situationsFranceFrench PolynesiaGabonGambia, TheGeorgiaGermanyGhanaGreeceGrenadaGuamGuatemalaGuineaGuinea-BissauGuyanaHaitiHeavily indebted poor countries (HIPC)High incomeHondurasHong Kong SAR, ChinaHungaryIBRD onlyIcelandIDA & IBRD totalIDA blendIDA onlyIDA totalIndiaIndonesiaIran, Islamic Rep.IraqIrelandIsraelItalyJamaicaJapanJordanKazakhstanKenyaKiribatiKorea, Dem. People’s Rep.Korea, Rep.KosovoKuwaitKyrgyz RepublicLao PDRLate-demographic dividendLatin America & Caribbean Latin America & Caribbean (excluding high income)Latin America & the Caribbean (IDA & IBRD countries)LatviaLeast developed countries: UN classificationLebanonLesothoLiberiaLibyaLithuaniaLow & middle incomeLow incomeLower middle incomeLuxembourgMacao SAR, ChinaMacedonia, FYRMadagascarMalawiMalaysiaMaldivesMaliMaltaMauritaniaMauritiusMexicoMicronesia, Fed. Sts.Middle East & North AfricaMiddle East & North Africa (excluding high income)Middle East & North Africa (IDA & IBRD countries)Middle incomeMoldovaMongoliaMontenegroMoroccoMozambiqueMyanmarNamibiaNepalNetherlandsNew CaledoniaNew ZealandNicaraguaNigerNigeriaNorth AmericaNorwayOECD membersOmanOther small statesPacific island small statesPakistanPanamaPapua New GuineaParaguayPeruPhilippinesPolandPortugalPost-demographic dividendPre-demographic dividendPuerto RicoQatarRomaniaRussian FederationRwandaSamoaSao Tome and PrincipeSaudi ArabiaSenegalSerbiaSeychellesSierra LeoneSingaporeSlovak RepublicSloveniaSmall statesSolomon IslandsSomaliaSouth AfricaSouth AsiaSouth Asia (IDA & IBRD)South SudanSpainSri LankaSt. LuciaSt. Vincent and the GrenadinesSub-Saharan Africa Sub-Saharan Africa (excluding high income)Sub-Saharan Africa (IDA & IBRD countries)SudanSurinameSwazilandSwedenSwitzerlandSyrian Arab RepublicTajikistanTanzaniaThailandTimor-LesteTogoTongaTrinidad and TobagoTunisiaTurkeyTurkmenistanUgandaUkraineUnited Arab EmiratesUnited KingdomUnited StatesUpper middle incomeUruguayUzbekistanVanuatuVenezuela, RBVietnamVirgin Islands (U.S.)West Bank and GazaWorldYemen, Rep.ZambiaZimbabwe Timeline:
This timeline shows a graph from 1961 to 2016 of Barbados. No data until 1960. Number of actual observations by date: 56.
Source name:
World Development Indicators
Source organization:
World Bank staff estimates based on age distributions of United Nations Population Division's World Population Prospects.
Categories, topics:
Education, Health
Last updated:
apr 23, 2017
Indicators value changes by year
Minimum:
53.758
jan 1, 1966
Maximum:
67.782
jan 1, 2009
At the date of observation
Value
Absolute change
Change from previous value
jan 1, 1961
55.108
+55.108
0.0%
jan 1, 1962
54.662
-0.447
-0.81%
jan 1, 1963
54.348
-0.314
-0.57%
jan 1, 1964
54.124
-0.224
-0.41%
jan 1, 1965
53.934
-0.19
-0.35%
jan 1, 1966
53.758
-0.177
-0.33%
jan 1, 1967
53.769
+0.011
0.02%
jan 1, 1968
53.872
+0.103
0.19%
jan 1, 1969
54.056
+0.184
0.34%
jan 1, 1970
54.306
+0.25
0.46%
jan 1, 1971
54.622
+0.316
0.58%
jan 1, 1972
55.615
+0.993
1.82%
jan 1, 1973
56.425
+0.81
1.46%
jan 1, 1974
57.116
+0.691
1.22%
jan 1, 1975
57.814
+0.698
1.22%
jan 1, 1976
58.572
+0.758
1.31%
jan 1, 1977
58.868
+0.296
0.51%
jan 1, 1978
59.326
+0.458
0.78%
jan 1, 1979
59.707
+0.382
0.64%
jan 1, 1980
59.821
+0.114
0.19%
jan 1, 1981
59.699
-0.123
-0.21%
jan 1, 1982
60.49
+0.792
1.33%
jan 1, 1983
61.069
+0.578
0.96%
jan 1, 1984
61.563
+0.494
0.81%
jan 1, 1985
62.138
+0.575
0.93%
jan 1, 1986
62.843
+0.705
1.13%
jan 1, 1987
63.35
+0.507
0.81%
jan 1, 1988
64.019
+0.669
1.06%
jan 1, 1989
64.745
+0.727
1.13%
jan 1, 1990
65.374
+0.629
0.97%
jan 1, 1991
65.837
+0.463
0.71%
jan 1, 1992
66.167
+0.329
0.5%
jan 1, 1993
66.32
+0.154
0.23%
jan 1, 1994
66.364
+0.044
0.07%
jan 1, 1995
66.398
+0.033
0.05%
jan 1, 1996
66.47
+0.072
0.11%
jan 1, 1997
66.499
+0.029
0.04%
jan 1, 1998
66.551
+0.053
0.08%
jan 1, 1999
66.6
+0.048
0.07%
jan 1, 2000
66.598
-0.002
0.0%
jan 1, 2001
66.532
-0.066
-0.1%
jan 1, 2002
66.833
+0.301
0.45%
jan 1, 2003
67.054
+0.221
0.33%
jan 1, 2004
67.221
+0.167
0.25%
jan 1, 2005
67.382
+0.16
0.24%
jan 1, 2006
67.553
+0.171
0.25%
jan 1, 2007
67.638
+0.085
0.13%
jan 1, 2008
67.727
+0.089
0.13%
jan 1, 2009
67.782
+0.055
0.08%
jan 1, 2010
67.749
-0.033
-0.05%
jan 1, 2011
67.615
-0.135
-0.2%
jan 1, 2012
67.559
-0.055
-0.08%
jan 1, 2013
67.385
-0.175
-0.26%
jan 1, 2014
67.117
-0.268
-0.4%
jan 1, 2015
66.803
-0.314
-0.47%
jan 1, 2016
66.47
-0.332
-0.5%
Ranking of countries by current statistics by years


Comments: