29
/
en
AIzaSyAYiBZKx7MnpbEhh9jyipgxe19OcubqV5w
April 1, 2024
190715
Mali
MLI
true
2
1
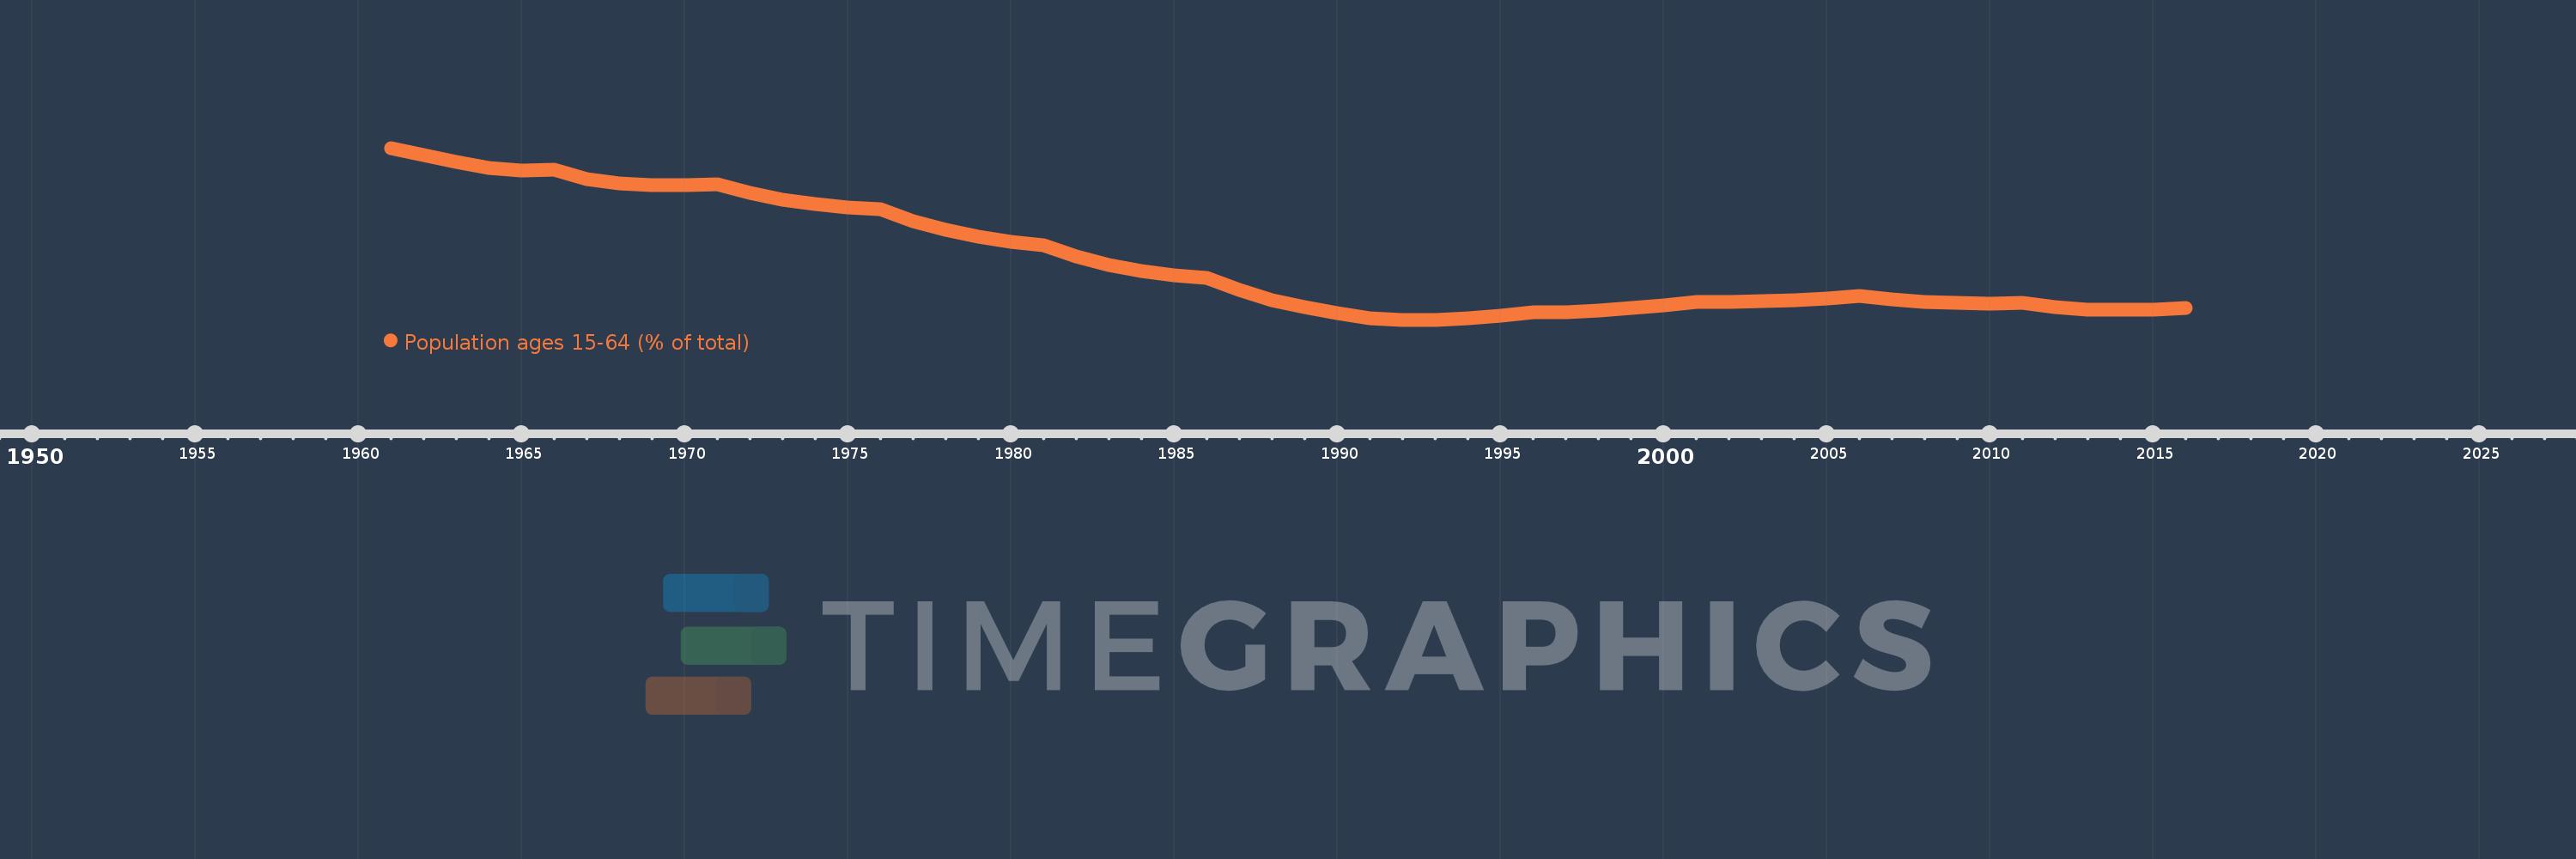
Population ages 15-64 (% of total)
2016,2015,2014,2013,2012,2011,2010,2009,2008,2007,2006,2005,2004,2003,2002,2001,2000,1999,1998,1997,1996,1995,1994,1993,1992,1991,1990,1989,1988,1987,1986,1985,1984,1983,1982,1981,1980,1979,1978,1977,1976,1975,1974,1973,1972,1971,1970,1969,1968,1967,1966,1965,1964,1963,1962,1961
This statistics in other country:
AfghanistanAlbaniaAlgeriaAngolaAntigua and BarbudaArab WorldArgentinaArmeniaArubaAustraliaAustriaAzerbaijanBahamas, TheBahrainBangladeshBarbadosBelarusBelgiumBelizeBeninBhutanBoliviaBosnia and HerzegovinaBotswanaBrazilBrunei DarussalamBulgariaBurkina FasoBurundiCabo VerdeCambodiaCameroonCanadaCaribbean small statesCentral African RepublicCentral Europe and the BalticsChadChannel IslandsChileChinaColombiaComorosCongo, Dem. Rep.Congo, Rep.Costa RicaCote d'IvoireCroatiaCubaCuracaoCyprusCzech RepublicDenmarkDjiboutiDominican RepublicEarly-demographic dividendEast Asia & PacificEast Asia & Pacific (excluding high income)East Asia & Pacific (IDA & IBRD countries)EcuadorEgypt, Arab Rep.El SalvadorEquatorial GuineaEritreaEstoniaEthiopiaEuro areaEurope & Central AsiaEurope & Central Asia (excluding high income)Europe & Central Asia (IDA & IBRD countries)European UnionFijiFinlandFragile and conflict affected situationsFranceFrench PolynesiaGabonGambia, TheGeorgiaGermanyGhanaGreeceGrenadaGuamGuatemalaGuineaGuinea-BissauGuyanaHaitiHeavily indebted poor countries (HIPC)High incomeHondurasHong Kong SAR, ChinaHungaryIBRD onlyIcelandIDA & IBRD totalIDA blendIDA onlyIDA totalIndiaIndonesiaIran, Islamic Rep.IraqIrelandIsraelItalyJamaicaJapanJordanKazakhstanKenyaKiribatiKorea, Dem. People’s Rep.Korea, Rep.KosovoKuwaitKyrgyz RepublicLao PDRLate-demographic dividendLatin America & Caribbean Latin America & Caribbean (excluding high income)Latin America & the Caribbean (IDA & IBRD countries)LatviaLeast developed countries: UN classificationLebanonLesothoLiberiaLibyaLithuaniaLow & middle incomeLow incomeLower middle incomeLuxembourgMacao SAR, ChinaMacedonia, FYRMadagascarMalawiMalaysiaMaldivesMaliMaltaMauritaniaMauritiusMexicoMicronesia, Fed. Sts.Middle East & North AfricaMiddle East & North Africa (excluding high income)Middle East & North Africa (IDA & IBRD countries)Middle incomeMoldovaMongoliaMontenegroMoroccoMozambiqueMyanmarNamibiaNepalNetherlandsNew CaledoniaNew ZealandNicaraguaNigerNigeriaNorth AmericaNorwayOECD membersOmanOther small statesPacific island small statesPakistanPanamaPapua New GuineaParaguayPeruPhilippinesPolandPortugalPost-demographic dividendPre-demographic dividendPuerto RicoQatarRomaniaRussian FederationRwandaSamoaSao Tome and PrincipeSaudi ArabiaSenegalSerbiaSeychellesSierra LeoneSingaporeSlovak RepublicSloveniaSmall statesSolomon IslandsSomaliaSouth AfricaSouth AsiaSouth Asia (IDA & IBRD)South SudanSpainSri LankaSt. LuciaSt. Vincent and the GrenadinesSub-Saharan Africa Sub-Saharan Africa (excluding high income)Sub-Saharan Africa (IDA & IBRD countries)SudanSurinameSwazilandSwedenSwitzerlandSyrian Arab RepublicTajikistanTanzaniaThailandTimor-LesteTogoTongaTrinidad and TobagoTunisiaTurkeyTurkmenistanUgandaUkraineUnited Arab EmiratesUnited KingdomUnited StatesUpper middle incomeUruguayUzbekistanVanuatuVenezuela, RBVietnamVirgin Islands (U.S.)West Bank and GazaWorldYemen, Rep.ZambiaZimbabwe Timeline:
This timeline shows a graph from 1961 to 2016 of Mali. No data until 1960. Number of actual observations by date: 56.
Source name:
World Development Indicators
Source organization:
World Bank staff estimates based on age distributions of United Nations Population Division's World Population Prospects.
Categories, topics:
Education, Health
Last updated:
apr 23, 2017
Indicators value changes by year
Minimum:
49.459
jan 1, 1992
Maximum:
56.904
jan 1, 1961
At the date of observation
Value
Absolute change
Change from previous value
jan 1, 1961
56.904
+56.904
0.0%
jan 1, 1962
56.577
-0.327
-0.57%
jan 1, 1963
56.279
-0.298
-0.53%
jan 1, 1964
56.039
-0.24
-0.43%
jan 1, 1965
55.926
-0.113
-0.2%
jan 1, 1966
55.964
+0.038
0.07%
jan 1, 1967
55.559
-0.405
-0.72%
jan 1, 1968
55.353
-0.206
-0.37%
jan 1, 1969
55.293
-0.06
-0.11%
jan 1, 1970
55.303
+0.01
0.02%
jan 1, 1971
55.338
+0.036
0.06%
jan 1, 1972
54.947
-0.392
-0.71%
jan 1, 1973
54.663
-0.284
-0.52%
jan 1, 1974
54.456
-0.206
-0.38%
jan 1, 1975
54.315
-0.141
-0.26%
jan 1, 1976
54.233
-0.082
-0.15%
jan 1, 1977
53.726
-0.507
-0.94%
jan 1, 1978
53.342
-0.384
-0.72%
jan 1, 1979
53.054
-0.287
-0.54%
jan 1, 1980
52.84
-0.214
-0.4%
jan 1, 1981
52.687
-0.154
-0.29%
jan 1, 1982
52.213
-0.474
-0.9%
jan 1, 1983
51.844
-0.369
-0.71%
jan 1, 1984
51.567
-0.277
-0.53%
jan 1, 1985
51.381
-0.186
-0.36%
jan 1, 1986
51.288
-0.093
-0.18%
jan 1, 1987
50.741
-0.546
-1.06%
jan 1, 1988
50.318
-0.424
-0.84%
jan 1, 1989
49.993
-0.325
-0.65%
jan 1, 1990
49.735
-0.258
-0.52%
jan 1, 1991
49.525
-0.21
-0.42%
jan 1, 1992
49.459
-0.066
-0.13%
jan 1, 1993
49.464
+0.005
0.01%
jan 1, 1994
49.524
+0.061
0.12%
jan 1, 1995
49.638
+0.114
0.23%
jan 1, 1996
49.801
+0.163
0.33%
jan 1, 1997
49.777
-0.024
-0.05%
jan 1, 1998
49.839
+0.062
0.12%
jan 1, 1999
49.954
+0.115
0.23%
jan 1, 2000
50.088
+0.134
0.27%
jan 1, 2001
50.225
+0.137
0.27%
jan 1, 2002
50.225
-0.001
0.0%
jan 1, 2003
50.261
+0.036
0.07%
jan 1, 2004
50.322
+0.061
0.12%
jan 1, 2005
50.397
+0.076
0.15%
jan 1, 2006
50.479
+0.082
0.16%
jan 1, 2007
50.337
-0.142
-0.28%
jan 1, 2008
50.239
-0.099
-0.2%
jan 1, 2009
50.178
-0.061
-0.12%
jan 1, 2010
50.16
-0.018
-0.04%
jan 1, 2011
50.19
+0.03
0.06%
jan 1, 2012
50.004
-0.186
-0.37%
jan 1, 2013
49.911
-0.093
-0.19%
jan 1, 2014
49.886
-0.025
-0.05%
jan 1, 2015
49.903
+0.018
0.04%
jan 1, 2016
49.954
+0.051
0.1%
Ranking of countries by current statistics by years


Comments: