29
/
en
AIzaSyAYiBZKx7MnpbEhh9jyipgxe19OcubqV5w
April 1, 2024
138536
Georgia
GEO
true
2
1
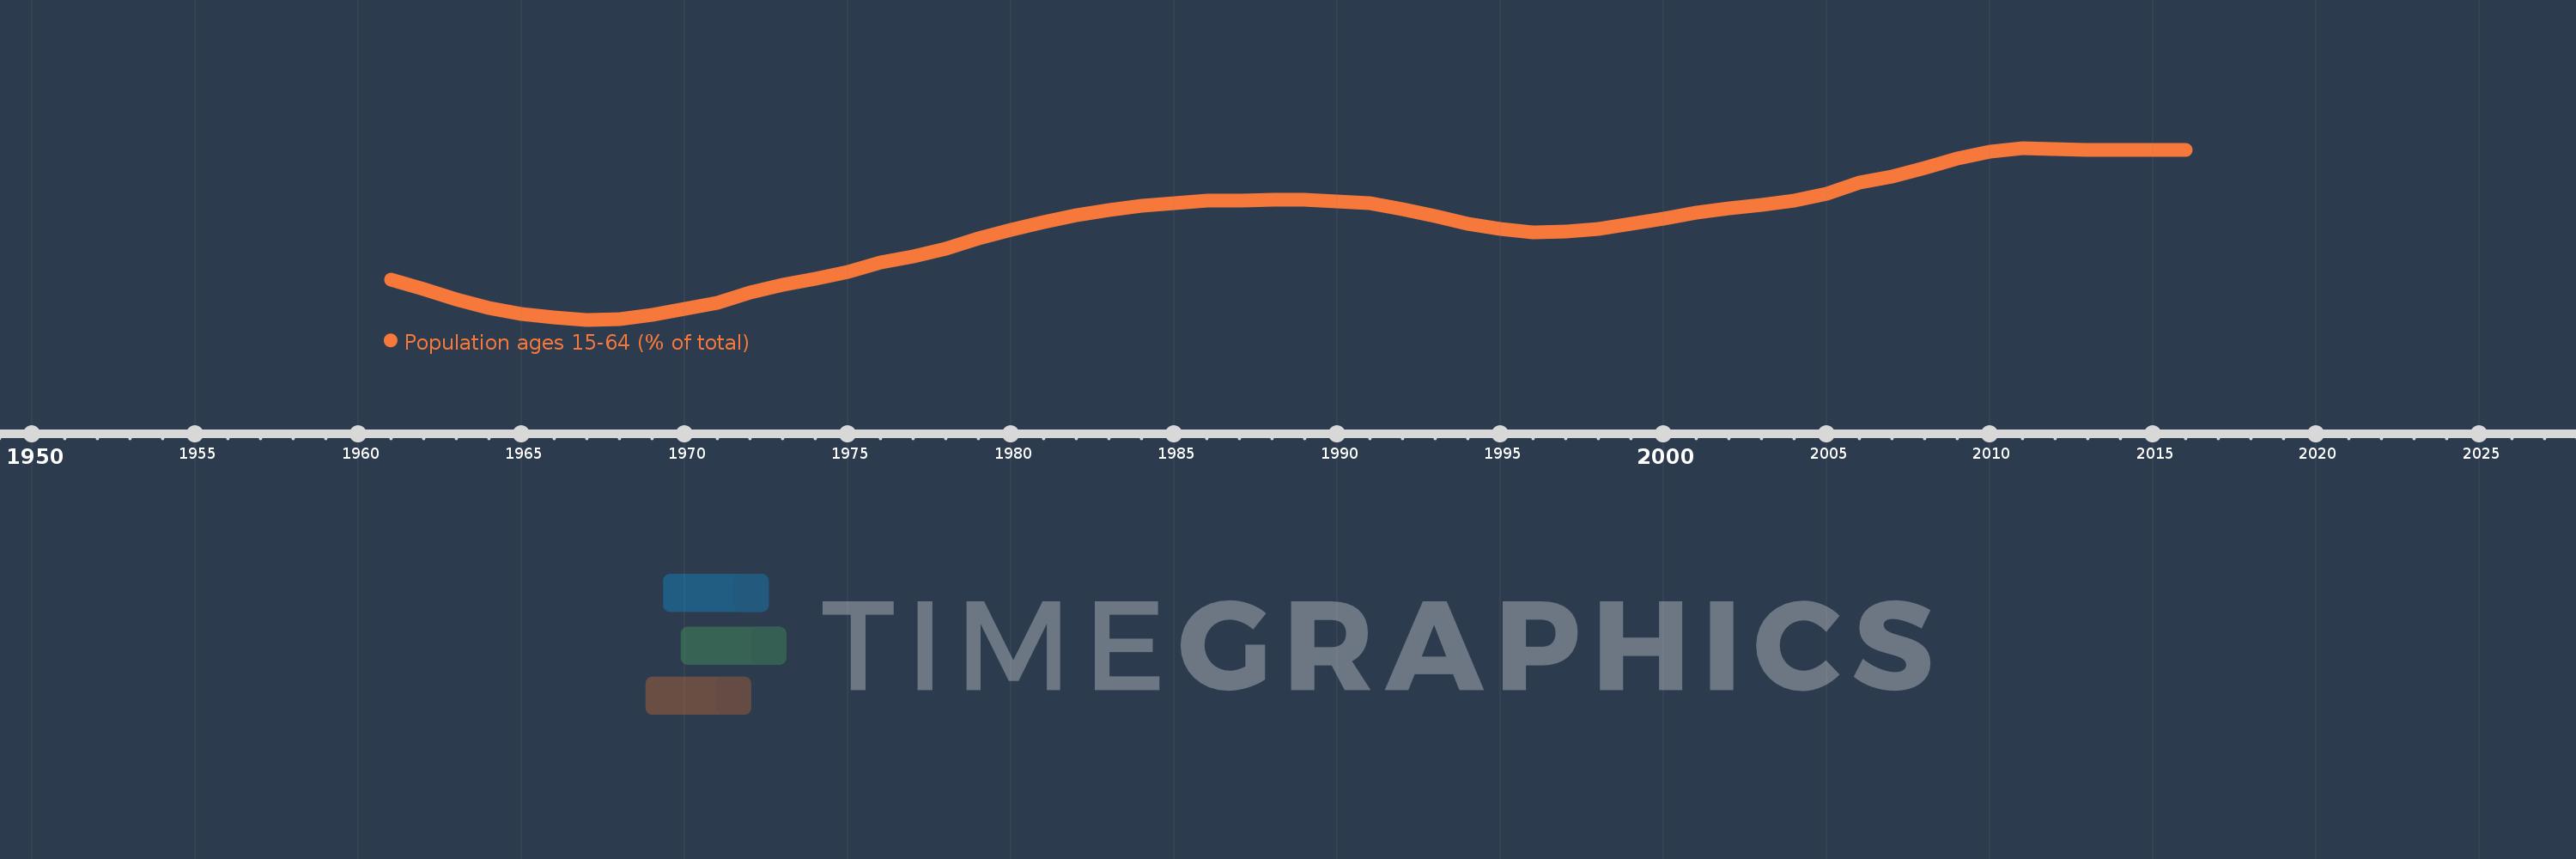
Population ages 15-64 (% of total)
2016,2015,2014,2013,2012,2011,2010,2009,2008,2007,2006,2005,2004,2003,2002,2001,2000,1999,1998,1997,1996,1995,1994,1993,1992,1991,1990,1989,1988,1987,1986,1985,1984,1983,1982,1981,1980,1979,1978,1977,1976,1975,1974,1973,1972,1971,1970,1969,1968,1967,1966,1965,1964,1963,1962,1961
This statistics in other country:
AfghanistanAlbaniaAlgeriaAngolaAntigua and BarbudaArab WorldArgentinaArmeniaArubaAustraliaAustriaAzerbaijanBahamas, TheBahrainBangladeshBarbadosBelarusBelgiumBelizeBeninBhutanBoliviaBosnia and HerzegovinaBotswanaBrazilBrunei DarussalamBulgariaBurkina FasoBurundiCabo VerdeCambodiaCameroonCanadaCaribbean small statesCentral African RepublicCentral Europe and the BalticsChadChannel IslandsChileChinaColombiaComorosCongo, Dem. Rep.Congo, Rep.Costa RicaCote d'IvoireCroatiaCubaCuracaoCyprusCzech RepublicDenmarkDjiboutiDominican RepublicEarly-demographic dividendEast Asia & PacificEast Asia & Pacific (excluding high income)East Asia & Pacific (IDA & IBRD countries)EcuadorEgypt, Arab Rep.El SalvadorEquatorial GuineaEritreaEstoniaEthiopiaEuro areaEurope & Central AsiaEurope & Central Asia (excluding high income)Europe & Central Asia (IDA & IBRD countries)European UnionFijiFinlandFragile and conflict affected situationsFranceFrench PolynesiaGabonGambia, TheGeorgiaGermanyGhanaGreeceGrenadaGuamGuatemalaGuineaGuinea-BissauGuyanaHaitiHeavily indebted poor countries (HIPC)High incomeHondurasHong Kong SAR, ChinaHungaryIBRD onlyIcelandIDA & IBRD totalIDA blendIDA onlyIDA totalIndiaIndonesiaIran, Islamic Rep.IraqIrelandIsraelItalyJamaicaJapanJordanKazakhstanKenyaKiribatiKorea, Dem. People’s Rep.Korea, Rep.KosovoKuwaitKyrgyz RepublicLao PDRLate-demographic dividendLatin America & Caribbean Latin America & Caribbean (excluding high income)Latin America & the Caribbean (IDA & IBRD countries)LatviaLeast developed countries: UN classificationLebanonLesothoLiberiaLibyaLithuaniaLow & middle incomeLow incomeLower middle incomeLuxembourgMacao SAR, ChinaMacedonia, FYRMadagascarMalawiMalaysiaMaldivesMaliMaltaMauritaniaMauritiusMexicoMicronesia, Fed. Sts.Middle East & North AfricaMiddle East & North Africa (excluding high income)Middle East & North Africa (IDA & IBRD countries)Middle incomeMoldovaMongoliaMontenegroMoroccoMozambiqueMyanmarNamibiaNepalNetherlandsNew CaledoniaNew ZealandNicaraguaNigerNigeriaNorth AmericaNorwayOECD membersOmanOther small statesPacific island small statesPakistanPanamaPapua New GuineaParaguayPeruPhilippinesPolandPortugalPost-demographic dividendPre-demographic dividendPuerto RicoQatarRomaniaRussian FederationRwandaSamoaSao Tome and PrincipeSaudi ArabiaSenegalSerbiaSeychellesSierra LeoneSingaporeSlovak RepublicSloveniaSmall statesSolomon IslandsSomaliaSouth AfricaSouth AsiaSouth Asia (IDA & IBRD)South SudanSpainSri LankaSt. LuciaSt. Vincent and the GrenadinesSub-Saharan Africa Sub-Saharan Africa (excluding high income)Sub-Saharan Africa (IDA & IBRD countries)SudanSurinameSwazilandSwedenSwitzerlandSyrian Arab RepublicTajikistanTanzaniaThailandTimor-LesteTogoTongaTrinidad and TobagoTunisiaTurkeyTurkmenistanUgandaUkraineUnited Arab EmiratesUnited KingdomUnited StatesUpper middle incomeUruguayUzbekistanVanuatuVenezuela, RBVietnamVirgin Islands (U.S.)West Bank and GazaWorldYemen, Rep.ZambiaZimbabwe Timeline:
This timeline shows a graph from 1961 to 2016 of Georgia. No data until 1960. Number of actual observations by date: 56.
Source name:
World Development Indicators
Source organization:
World Bank staff estimates based on age distributions of United Nations Population Division's World Population Prospects.
Categories, topics:
Education, Health
Last updated:
apr 23, 2017
Indicators value changes by year
Minimum:
60.317
jan 1, 1967
Maximum:
68.754
jan 1, 2011
At the date of observation
Value
Absolute change
Change from previous value
jan 1, 1961
62.306
+62.306
0.0%
jan 1, 1962
61.804
-0.502
-0.81%
jan 1, 1963
61.322
-0.482
-0.78%
jan 1, 1964
60.901
-0.42
-0.69%
jan 1, 1965
60.6
-0.302
-0.5%
jan 1, 1966
60.439
-0.161
-0.27%
jan 1, 1967
60.317
-0.122
-0.2%
jan 1, 1968
60.36
+0.043
0.07%
jan 1, 1969
60.553
+0.193
0.32%
jan 1, 1970
60.832
+0.278
0.46%
jan 1, 1971
61.144
+0.313
0.51%
jan 1, 1972
61.648
+0.504
0.82%
jan 1, 1973
62.027
+0.379
0.61%
jan 1, 1974
62.336
+0.309
0.5%
jan 1, 1975
62.677
+0.341
0.55%
jan 1, 1976
63.111
+0.434
0.69%
jan 1, 1977
63.41
+0.3
0.47%
jan 1, 1978
63.816
+0.406
0.64%
jan 1, 1979
64.295
+0.479
0.75%
jan 1, 1980
64.753
+0.458
0.71%
jan 1, 1981
65.13
+0.377
0.58%
jan 1, 1982
65.46
+0.329
0.51%
jan 1, 1983
65.718
+0.258
0.39%
jan 1, 1984
65.904
+0.186
0.28%
jan 1, 1985
66.046
+0.141
0.21%
jan 1, 1986
66.156
+0.11
0.17%
jan 1, 1987
66.186
+0.031
0.05%
jan 1, 1988
66.2
+0.014
0.02%
jan 1, 1989
66.192
-0.008
-0.01%
jan 1, 1990
66.14
-0.052
-0.08%
jan 1, 1991
66.037
-0.104
-0.16%
jan 1, 1992
65.732
-0.305
-0.46%
jan 1, 1993
65.389
-0.342
-0.52%
jan 1, 1994
65.046
-0.344
-0.53%
jan 1, 1995
64.769
-0.277
-0.43%
jan 1, 1996
64.612
-0.156
-0.24%
jan 1, 1997
64.629
+0.017
0.03%
jan 1, 1998
64.772
+0.143
0.22%
jan 1, 1999
65.015
+0.243
0.37%
jan 1, 2000
65.297
+0.282
0.43%
jan 1, 2001
65.58
+0.283
0.43%
jan 1, 2002
65.792
+0.212
0.32%
jan 1, 2003
65.962
+0.17
0.26%
jan 1, 2004
66.169
+0.208
0.31%
jan 1, 2005
66.519
+0.349
0.53%
jan 1, 2006
67.05
+0.531
0.8%
jan 1, 2007
67.336
+0.287
0.43%
jan 1, 2008
67.767
+0.43
0.64%
jan 1, 2009
68.222
+0.455
0.67%
jan 1, 2010
68.566
+0.344
0.5%
jan 1, 2011
68.754
+0.187
0.27%
jan 1, 2012
68.708
-0.046
-0.07%
jan 1, 2013
68.676
-0.032
-0.05%
jan 1, 2014
68.668
-0.008
-0.01%
jan 1, 2015
68.672
+0.004
0.01%
jan 1, 2016
68.647
-0.025
-0.04%
Ranking of countries by current statistics by years


Comments: