29
/
en
AIzaSyAYiBZKx7MnpbEhh9jyipgxe19OcubqV5w
April 1, 2024
193471
Mauritania
MRT
true
2
1
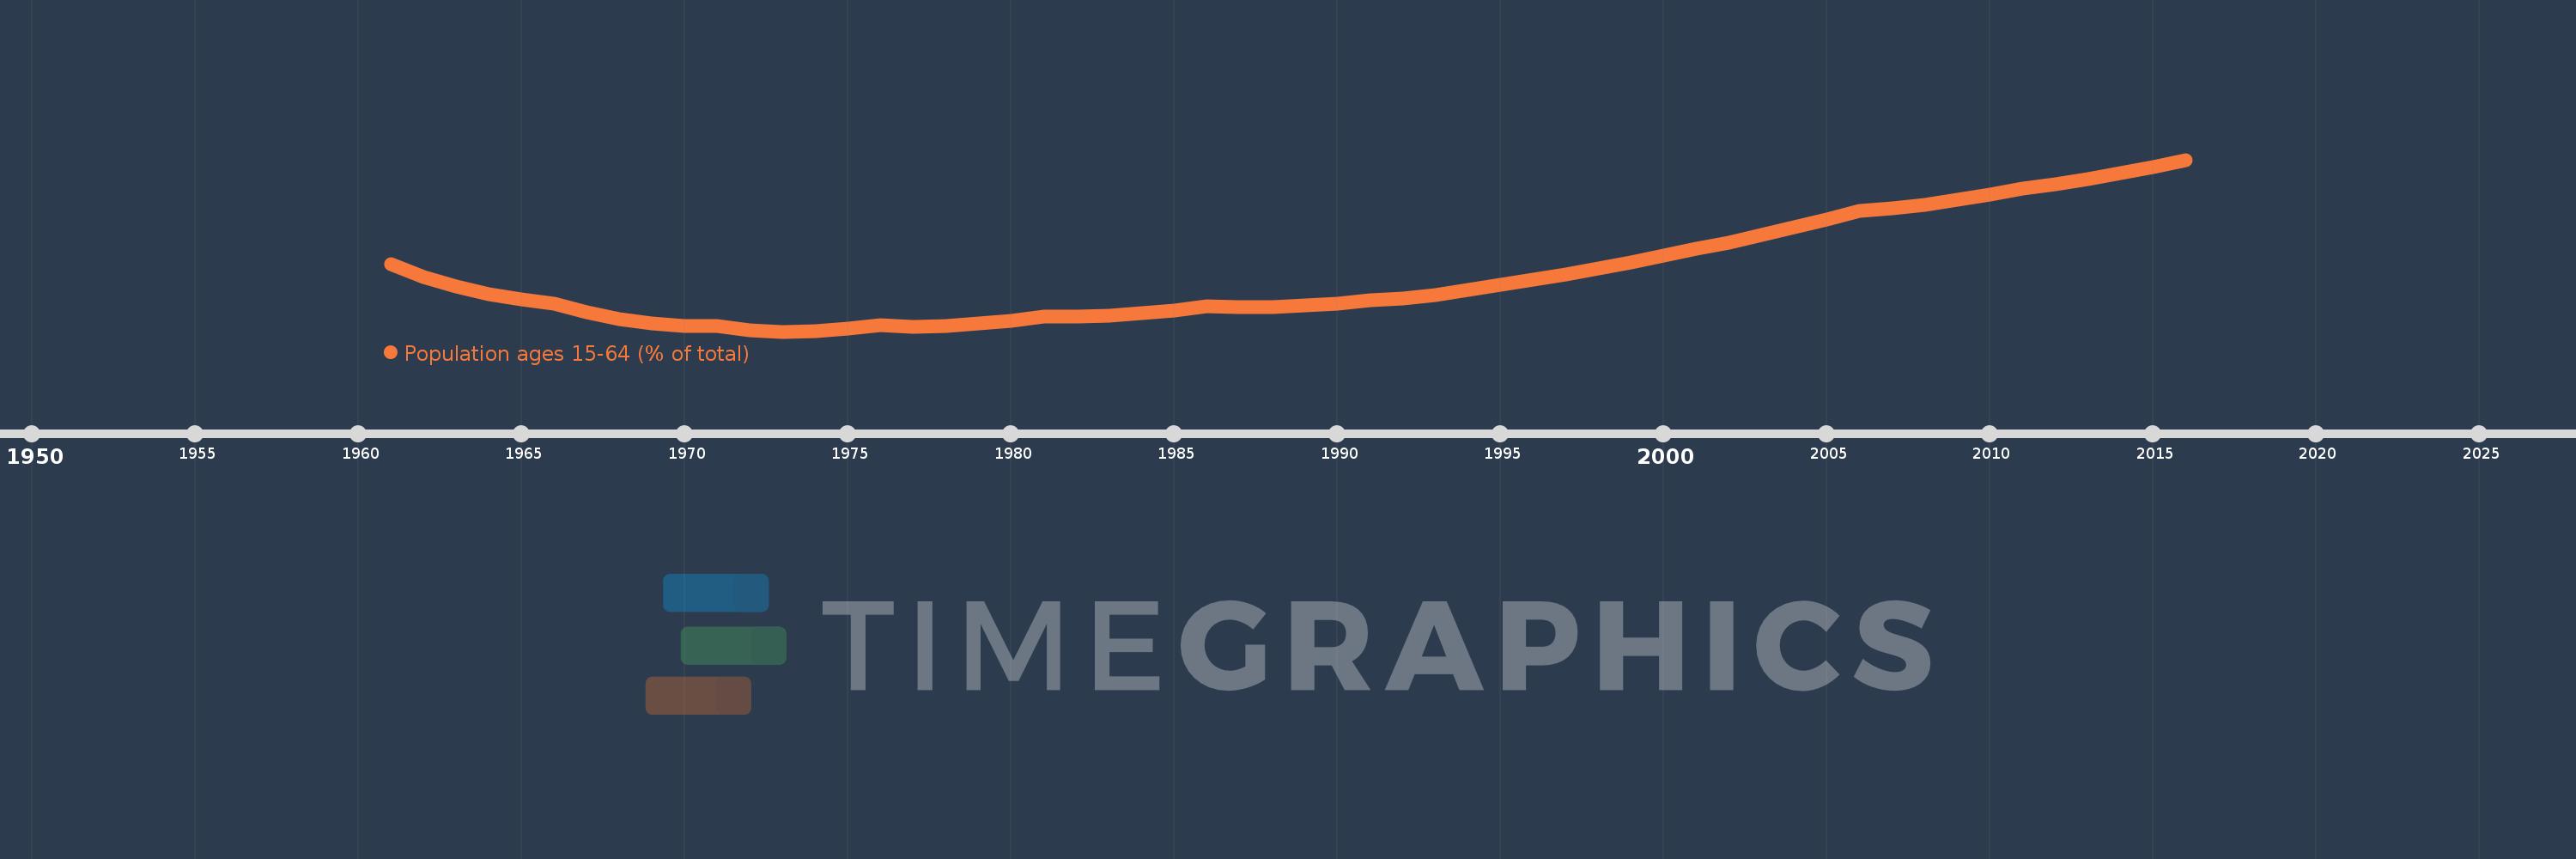
Population ages 15-64 (% of total)
2016,2015,2014,2013,2012,2011,2010,2009,2008,2007,2006,2005,2004,2003,2002,2001,2000,1999,1998,1997,1996,1995,1994,1993,1992,1991,1990,1989,1988,1987,1986,1985,1984,1983,1982,1981,1980,1979,1978,1977,1976,1975,1974,1973,1972,1971,1970,1969,1968,1967,1966,1965,1964,1963,1962,1961
This statistics in other country:
AfghanistanAlbaniaAlgeriaAngolaAntigua and BarbudaArab WorldArgentinaArmeniaArubaAustraliaAustriaAzerbaijanBahamas, TheBahrainBangladeshBarbadosBelarusBelgiumBelizeBeninBhutanBoliviaBosnia and HerzegovinaBotswanaBrazilBrunei DarussalamBulgariaBurkina FasoBurundiCabo VerdeCambodiaCameroonCanadaCaribbean small statesCentral African RepublicCentral Europe and the BalticsChadChannel IslandsChileChinaColombiaComorosCongo, Dem. Rep.Congo, Rep.Costa RicaCote d'IvoireCroatiaCubaCuracaoCyprusCzech RepublicDenmarkDjiboutiDominican RepublicEarly-demographic dividendEast Asia & PacificEast Asia & Pacific (excluding high income)East Asia & Pacific (IDA & IBRD countries)EcuadorEgypt, Arab Rep.El SalvadorEquatorial GuineaEritreaEstoniaEthiopiaEuro areaEurope & Central AsiaEurope & Central Asia (excluding high income)Europe & Central Asia (IDA & IBRD countries)European UnionFijiFinlandFragile and conflict affected situationsFranceFrench PolynesiaGabonGambia, TheGeorgiaGermanyGhanaGreeceGrenadaGuamGuatemalaGuineaGuinea-BissauGuyanaHaitiHeavily indebted poor countries (HIPC)High incomeHondurasHong Kong SAR, ChinaHungaryIBRD onlyIcelandIDA & IBRD totalIDA blendIDA onlyIDA totalIndiaIndonesiaIran, Islamic Rep.IraqIrelandIsraelItalyJamaicaJapanJordanKazakhstanKenyaKiribatiKorea, Dem. People’s Rep.Korea, Rep.KosovoKuwaitKyrgyz RepublicLao PDRLate-demographic dividendLatin America & Caribbean Latin America & Caribbean (excluding high income)Latin America & the Caribbean (IDA & IBRD countries)LatviaLeast developed countries: UN classificationLebanonLesothoLiberiaLibyaLithuaniaLow & middle incomeLow incomeLower middle incomeLuxembourgMacao SAR, ChinaMacedonia, FYRMadagascarMalawiMalaysiaMaldivesMaliMaltaMauritaniaMauritiusMexicoMicronesia, Fed. Sts.Middle East & North AfricaMiddle East & North Africa (excluding high income)Middle East & North Africa (IDA & IBRD countries)Middle incomeMoldovaMongoliaMontenegroMoroccoMozambiqueMyanmarNamibiaNepalNetherlandsNew CaledoniaNew ZealandNicaraguaNigerNigeriaNorth AmericaNorwayOECD membersOmanOther small statesPacific island small statesPakistanPanamaPapua New GuineaParaguayPeruPhilippinesPolandPortugalPost-demographic dividendPre-demographic dividendPuerto RicoQatarRomaniaRussian FederationRwandaSamoaSao Tome and PrincipeSaudi ArabiaSenegalSerbiaSeychellesSierra LeoneSingaporeSlovak RepublicSloveniaSmall statesSolomon IslandsSomaliaSouth AfricaSouth AsiaSouth Asia (IDA & IBRD)South SudanSpainSri LankaSt. LuciaSt. Vincent and the GrenadinesSub-Saharan Africa Sub-Saharan Africa (excluding high income)Sub-Saharan Africa (IDA & IBRD countries)SudanSurinameSwazilandSwedenSwitzerlandSyrian Arab RepublicTajikistanTanzaniaThailandTimor-LesteTogoTongaTrinidad and TobagoTunisiaTurkeyTurkmenistanUgandaUkraineUnited Arab EmiratesUnited KingdomUnited StatesUpper middle incomeUruguayUzbekistanVanuatuVenezuela, RBVietnamVirgin Islands (U.S.)West Bank and GazaWorldYemen, Rep.ZambiaZimbabwe Timeline:
This timeline shows a graph from 1961 to 2016 of Mauritania. No data until 1960. Number of actual observations by date: 56.
Source name:
World Development Indicators
Source organization:
World Bank staff estimates based on age distributions of United Nations Population Division's World Population Prospects.
Categories, topics:
Education, Health
Last updated:
apr 23, 2017
Indicators value changes by year
Minimum:
51.313
jan 1, 1973
Maximum:
56.774
jan 1, 2016
At the date of observation
Value
Absolute change
Change from previous value
jan 1, 1961
53.445
+53.445
0.0%
jan 1, 1962
53.041
-0.404
-0.76%
jan 1, 1963
52.739
-0.301
-0.57%
jan 1, 1964
52.511
-0.228
-0.43%
jan 1, 1965
52.331
-0.18
-0.34%
jan 1, 1966
52.191
-0.141
-0.27%
jan 1, 1967
51.917
-0.273
-0.52%
jan 1, 1968
51.709
-0.208
-0.4%
jan 1, 1969
51.566
-0.143
-0.28%
jan 1, 1970
51.497
-0.069
-0.13%
jan 1, 1971
51.501
+0.004
0.01%
jan 1, 1972
51.361
-0.14
-0.27%
jan 1, 1973
51.313
-0.048
-0.09%
jan 1, 1974
51.338
+0.024
0.05%
jan 1, 1975
51.41
+0.072
0.14%
jan 1, 1976
51.516
+0.106
0.21%
jan 1, 1977
51.472
-0.044
-0.08%
jan 1, 1978
51.491
+0.019
0.04%
jan 1, 1979
51.559
+0.068
0.13%
jan 1, 1980
51.662
+0.103
0.2%
jan 1, 1981
51.793
+0.131
0.25%
jan 1, 1982
51.78
-0.013
-0.03%
jan 1, 1983
51.817
+0.037
0.07%
jan 1, 1984
51.892
+0.075
0.14%
jan 1, 1985
51.993
+0.101
0.2%
jan 1, 1986
52.114
+0.121
0.23%
jan 1, 1987
52.095
-0.019
-0.04%
jan 1, 1988
52.104
+0.009
0.02%
jan 1, 1989
52.141
+0.037
0.07%
jan 1, 1990
52.209
+0.068
0.13%
jan 1, 1991
52.306
+0.097
0.19%
jan 1, 1992
52.372
+0.066
0.13%
jan 1, 1993
52.485
+0.113
0.22%
jan 1, 1994
52.629
+0.145
0.28%
jan 1, 1995
52.79
+0.16
0.3%
jan 1, 1996
52.956
+0.167
0.32%
jan 1, 1997
53.122
+0.166
0.31%
jan 1, 1998
53.307
+0.185
0.35%
jan 1, 1999
53.507
+0.2
0.38%
jan 1, 2000
53.722
+0.215
0.4%
jan 1, 2001
53.95
+0.228
0.42%
jan 1, 2002
54.149
+0.199
0.37%
jan 1, 2003
54.374
+0.225
0.41%
jan 1, 2004
54.617
+0.243
0.45%
jan 1, 2005
54.875
+0.258
0.47%
jan 1, 2006
55.146
+0.271
0.49%
jan 1, 2007
55.234
+0.088
0.16%
jan 1, 2008
55.352
+0.118
0.21%
jan 1, 2009
55.498
+0.145
0.26%
jan 1, 2010
55.667
+0.169
0.3%
jan 1, 2011
55.856
+0.189
0.34%
jan 1, 2012
55.988
+0.132
0.24%
jan 1, 2013
56.151
+0.163
0.29%
jan 1, 2014
56.34
+0.188
0.34%
jan 1, 2015
56.548
+0.208
0.37%
jan 1, 2016
56.774
+0.226
0.4%
Ranking of countries by current statistics by years


Comments: