29
/
en
AIzaSyAYiBZKx7MnpbEhh9jyipgxe19OcubqV5w
April 1, 2024
243021
Slovenia
SVN
true
2
1
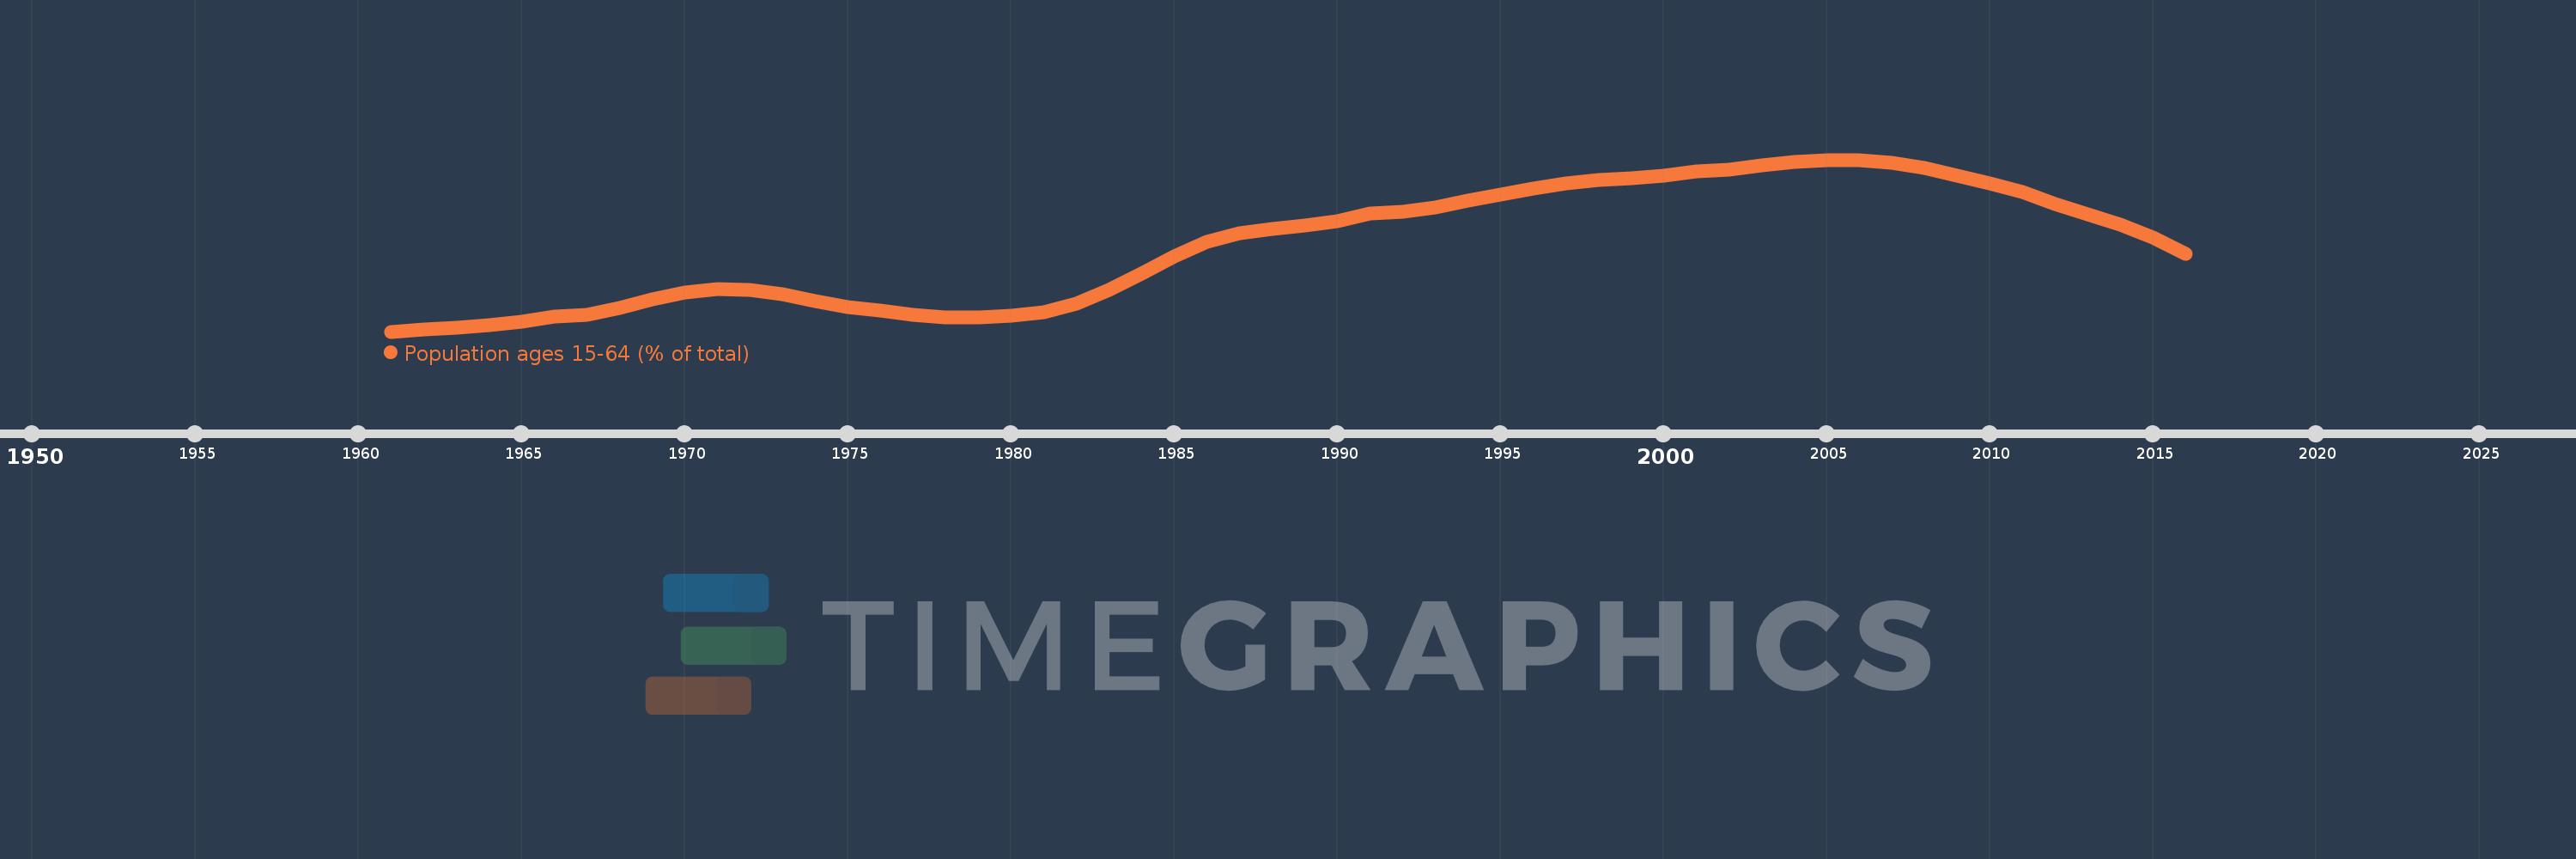
Population ages 15-64 (% of total)
2016,2015,2014,2013,2012,2011,2010,2009,2008,2007,2006,2005,2004,2003,2002,2001,2000,1999,1998,1997,1996,1995,1994,1993,1992,1991,1990,1989,1988,1987,1986,1985,1984,1983,1982,1981,1980,1979,1978,1977,1976,1975,1974,1973,1972,1971,1970,1969,1968,1967,1966,1965,1964,1963,1962,1961
This statistics in other country:
AfghanistanAlbaniaAlgeriaAngolaAntigua and BarbudaArab WorldArgentinaArmeniaArubaAustraliaAustriaAzerbaijanBahamas, TheBahrainBangladeshBarbadosBelarusBelgiumBelizeBeninBhutanBoliviaBosnia and HerzegovinaBotswanaBrazilBrunei DarussalamBulgariaBurkina FasoBurundiCabo VerdeCambodiaCameroonCanadaCaribbean small statesCentral African RepublicCentral Europe and the BalticsChadChannel IslandsChileChinaColombiaComorosCongo, Dem. Rep.Congo, Rep.Costa RicaCote d'IvoireCroatiaCubaCuracaoCyprusCzech RepublicDenmarkDjiboutiDominican RepublicEarly-demographic dividendEast Asia & PacificEast Asia & Pacific (excluding high income)East Asia & Pacific (IDA & IBRD countries)EcuadorEgypt, Arab Rep.El SalvadorEquatorial GuineaEritreaEstoniaEthiopiaEuro areaEurope & Central AsiaEurope & Central Asia (excluding high income)Europe & Central Asia (IDA & IBRD countries)European UnionFijiFinlandFragile and conflict affected situationsFranceFrench PolynesiaGabonGambia, TheGeorgiaGermanyGhanaGreeceGrenadaGuamGuatemalaGuineaGuinea-BissauGuyanaHaitiHeavily indebted poor countries (HIPC)High incomeHondurasHong Kong SAR, ChinaHungaryIBRD onlyIcelandIDA & IBRD totalIDA blendIDA onlyIDA totalIndiaIndonesiaIran, Islamic Rep.IraqIrelandIsraelItalyJamaicaJapanJordanKazakhstanKenyaKiribatiKorea, Dem. People’s Rep.Korea, Rep.KosovoKuwaitKyrgyz RepublicLao PDRLate-demographic dividendLatin America & Caribbean Latin America & Caribbean (excluding high income)Latin America & the Caribbean (IDA & IBRD countries)LatviaLeast developed countries: UN classificationLebanonLesothoLiberiaLibyaLithuaniaLow & middle incomeLow incomeLower middle incomeLuxembourgMacao SAR, ChinaMacedonia, FYRMadagascarMalawiMalaysiaMaldivesMaliMaltaMauritaniaMauritiusMexicoMicronesia, Fed. Sts.Middle East & North AfricaMiddle East & North Africa (excluding high income)Middle East & North Africa (IDA & IBRD countries)Middle incomeMoldovaMongoliaMontenegroMoroccoMozambiqueMyanmarNamibiaNepalNetherlandsNew CaledoniaNew ZealandNicaraguaNigerNigeriaNorth AmericaNorwayOECD membersOmanOther small statesPacific island small statesPakistanPanamaPapua New GuineaParaguayPeruPhilippinesPolandPortugalPost-demographic dividendPre-demographic dividendPuerto RicoQatarRomaniaRussian FederationRwandaSamoaSao Tome and PrincipeSaudi ArabiaSenegalSerbiaSeychellesSierra LeoneSingaporeSlovak RepublicSloveniaSmall statesSolomon IslandsSomaliaSouth AfricaSouth AsiaSouth Asia (IDA & IBRD)South SudanSpainSri LankaSt. LuciaSt. Vincent and the GrenadinesSub-Saharan Africa Sub-Saharan Africa (excluding high income)Sub-Saharan Africa (IDA & IBRD countries)SudanSurinameSwazilandSwedenSwitzerlandSyrian Arab RepublicTajikistanTanzaniaThailandTimor-LesteTogoTongaTrinidad and TobagoTunisiaTurkeyTurkmenistanUgandaUkraineUnited Arab EmiratesUnited KingdomUnited StatesUpper middle incomeUruguayUzbekistanVanuatuVenezuela, RBVietnamVirgin Islands (U.S.)West Bank and GazaWorldYemen, Rep.ZambiaZimbabwe Timeline:
This timeline shows a graph from 1961 to 2016 of Slovenia. No data until 1960. Number of actual observations by date: 56.
Source name:
World Development Indicators
Source organization:
World Bank staff estimates based on age distributions of United Nations Population Division's World Population Prospects.
Categories, topics:
Education, Health
Last updated:
apr 23, 2017
Indicators value changes by year
Maximum:
70.495
jan 1, 2005
At the date of observation
Value
Absolute change
Change from previous value
jan 1, 1961
64.56
+64.56
0.0%
jan 1, 1962
64.623
+0.063
0.1%
jan 1, 1963
64.688
+0.065
0.1%
jan 1, 1964
64.776
+0.088
0.14%
jan 1, 1965
64.903
+0.127
0.2%
jan 1, 1966
65.069
+0.166
0.26%
jan 1, 1967
65.151
+0.082
0.13%
jan 1, 1968
65.376
+0.225
0.34%
jan 1, 1969
65.662
+0.286
0.44%
jan 1, 1970
65.896
+0.234
0.36%
jan 1, 1971
66.018
+0.122
0.19%
jan 1, 1972
65.995
-0.024
-0.04%
jan 1, 1973
65.838
-0.157
-0.24%
jan 1, 1974
65.611
-0.227
-0.34%
jan 1, 1975
65.412
-0.199
-0.3%
jan 1, 1976
65.289
-0.123
-0.19%
jan 1, 1977
65.138
-0.151
-0.23%
jan 1, 1978
65.06
-0.078
-0.12%
jan 1, 1979
65.045
-0.014
-0.02%
jan 1, 1980
65.101
+0.056
0.09%
jan 1, 1981
65.236
+0.135
0.21%
jan 1, 1982
65.522
+0.287
0.44%
jan 1, 1983
65.99
+0.467
0.71%
jan 1, 1984
66.575
+0.585
0.89%
jan 1, 1985
67.164
+0.589
0.88%
jan 1, 1986
67.673
+0.51
0.76%
jan 1, 1987
67.96
+0.287
0.42%
jan 1, 1988
68.116
+0.156
0.23%
jan 1, 1989
68.217
+0.101
0.15%
jan 1, 1990
68.371
+0.154
0.23%
jan 1, 1991
68.629
+0.258
0.38%
jan 1, 1992
68.687
+0.058
0.08%
jan 1, 1993
68.849
+0.161
0.23%
jan 1, 1994
69.077
+0.228
0.33%
jan 1, 1995
69.304
+0.228
0.33%
jan 1, 1996
69.487
+0.183
0.26%
jan 1, 1997
69.668
+0.181
0.26%
jan 1, 1998
69.786
+0.118
0.17%
jan 1, 1999
69.868
+0.081
0.12%
jan 1, 2000
69.96
+0.093
0.13%
jan 1, 2001
70.087
+0.126
0.18%
jan 1, 2002
70.167
+0.081
0.11%
jan 1, 2003
70.292
+0.124
0.18%
jan 1, 2004
70.421
+0.129
0.18%
jan 1, 2005
70.495
+0.074
0.11%
jan 1, 2006
70.482
-0.013
-0.02%
jan 1, 2007
70.398
-0.084
-0.12%
jan 1, 2008
70.209
-0.189
-0.27%
jan 1, 2009
69.947
-0.262
-0.37%
jan 1, 2010
69.667
-0.28
-0.4%
jan 1, 2011
69.391
-0.275
-0.4%
jan 1, 2012
68.975
-0.417
-0.6%
jan 1, 2013
68.606
-0.369
-0.53%
jan 1, 2014
68.24
-0.366
-0.53%
jan 1, 2015
67.799
-0.441
-0.65%
jan 1, 2016
67.247
-0.552
-0.81%
Ranking of countries by current statistics by years


Comments: