29
/
en
AIzaSyAYiBZKx7MnpbEhh9jyipgxe19OcubqV5w
April 1, 2024
285087
Yemen, Rep.
YEM
true
2
1
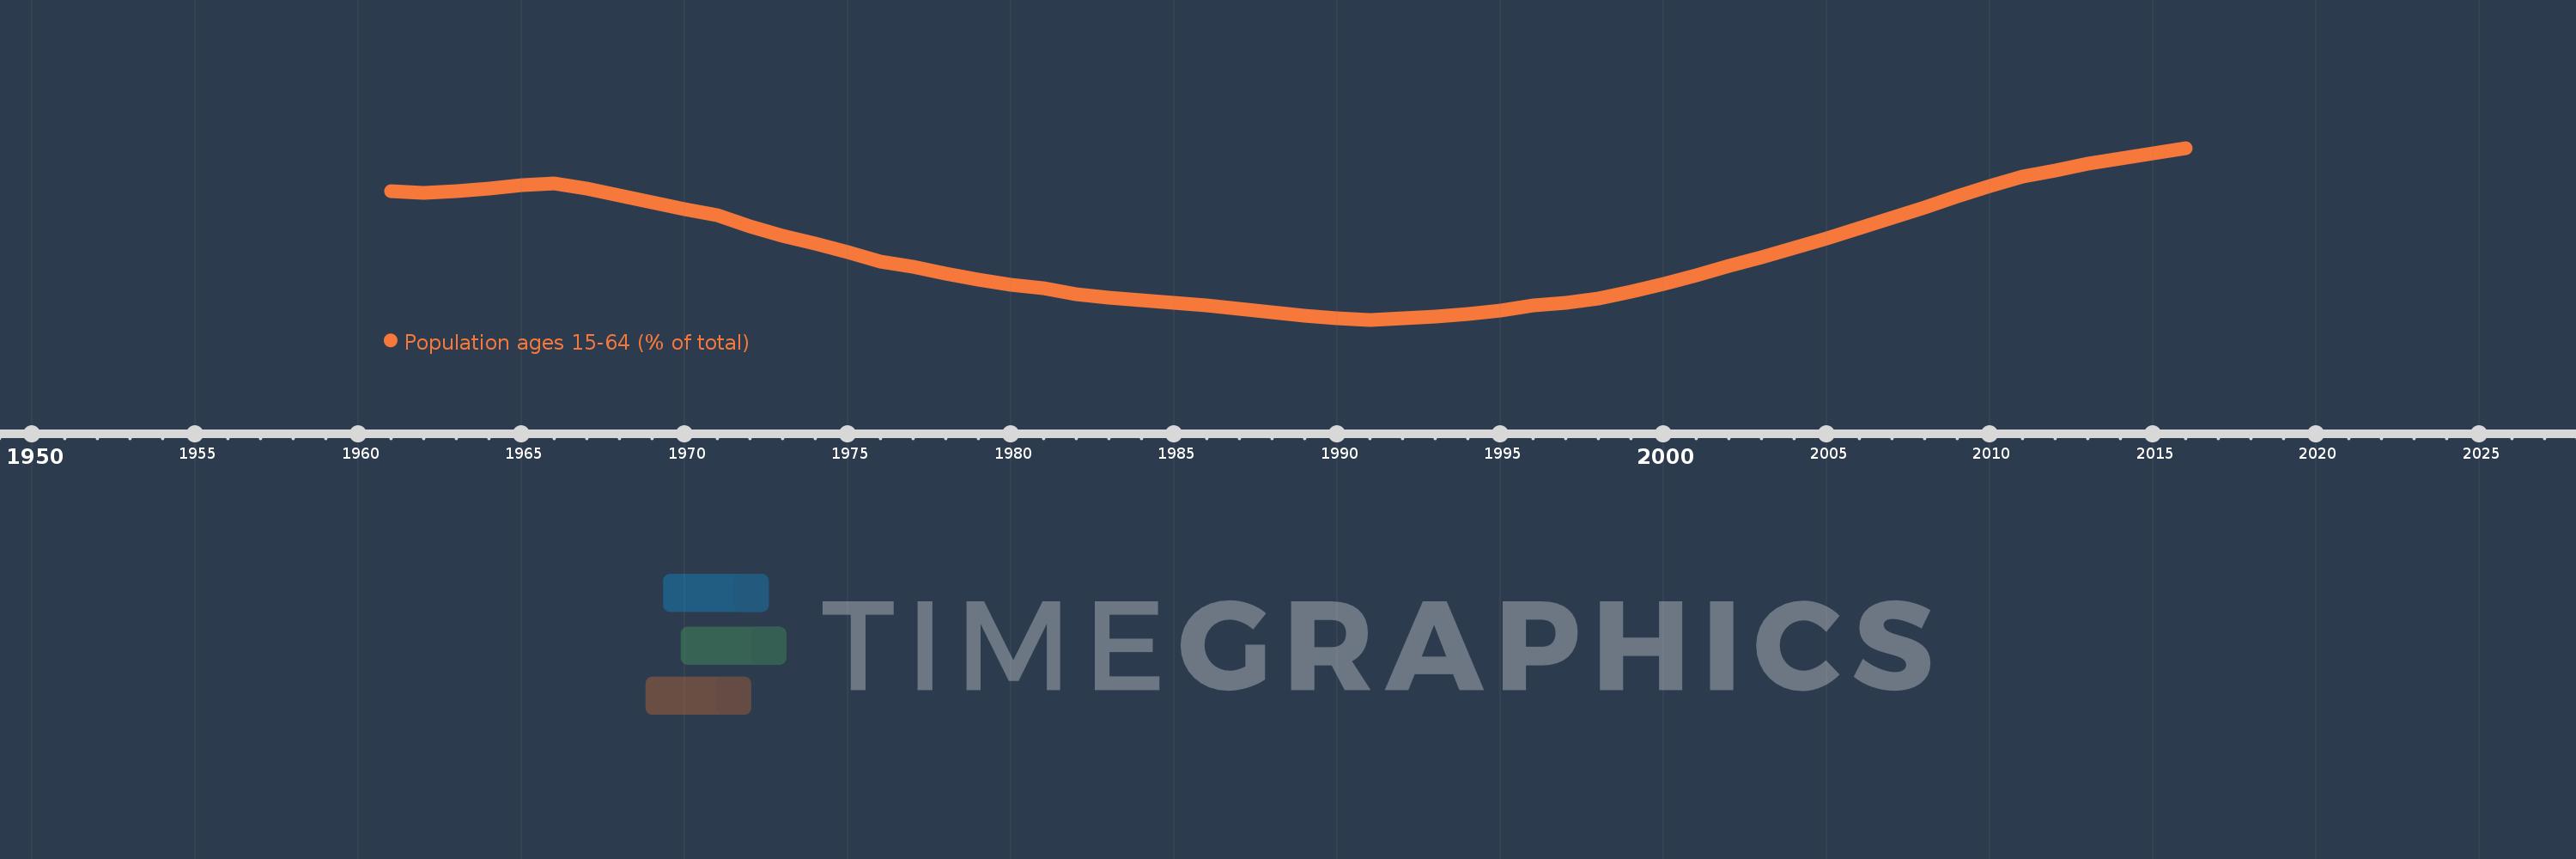
Population ages 15-64 (% of total)
2016,2015,2014,2013,2012,2011,2010,2009,2008,2007,2006,2005,2004,2003,2002,2001,2000,1999,1998,1997,1996,1995,1994,1993,1992,1991,1990,1989,1988,1987,1986,1985,1984,1983,1982,1981,1980,1979,1978,1977,1976,1975,1974,1973,1972,1971,1970,1969,1968,1967,1966,1965,1964,1963,1962,1961
This statistics in other country:
AfghanistanAlbaniaAlgeriaAngolaAntigua and BarbudaArab WorldArgentinaArmeniaArubaAustraliaAustriaAzerbaijanBahamas, TheBahrainBangladeshBarbadosBelarusBelgiumBelizeBeninBhutanBoliviaBosnia and HerzegovinaBotswanaBrazilBrunei DarussalamBulgariaBurkina FasoBurundiCabo VerdeCambodiaCameroonCanadaCaribbean small statesCentral African RepublicCentral Europe and the BalticsChadChannel IslandsChileChinaColombiaComorosCongo, Dem. Rep.Congo, Rep.Costa RicaCote d'IvoireCroatiaCubaCuracaoCyprusCzech RepublicDenmarkDjiboutiDominican RepublicEarly-demographic dividendEast Asia & PacificEast Asia & Pacific (excluding high income)East Asia & Pacific (IDA & IBRD countries)EcuadorEgypt, Arab Rep.El SalvadorEquatorial GuineaEritreaEstoniaEthiopiaEuro areaEurope & Central AsiaEurope & Central Asia (excluding high income)Europe & Central Asia (IDA & IBRD countries)European UnionFijiFinlandFragile and conflict affected situationsFranceFrench PolynesiaGabonGambia, TheGeorgiaGermanyGhanaGreeceGrenadaGuamGuatemalaGuineaGuinea-BissauGuyanaHaitiHeavily indebted poor countries (HIPC)High incomeHondurasHong Kong SAR, ChinaHungaryIBRD onlyIcelandIDA & IBRD totalIDA blendIDA onlyIDA totalIndiaIndonesiaIran, Islamic Rep.IraqIrelandIsraelItalyJamaicaJapanJordanKazakhstanKenyaKiribatiKorea, Dem. People’s Rep.Korea, Rep.KosovoKuwaitKyrgyz RepublicLao PDRLate-demographic dividendLatin America & Caribbean Latin America & Caribbean (excluding high income)Latin America & the Caribbean (IDA & IBRD countries)LatviaLeast developed countries: UN classificationLebanonLesothoLiberiaLibyaLithuaniaLow & middle incomeLow incomeLower middle incomeLuxembourgMacao SAR, ChinaMacedonia, FYRMadagascarMalawiMalaysiaMaldivesMaliMaltaMauritaniaMauritiusMexicoMicronesia, Fed. Sts.Middle East & North AfricaMiddle East & North Africa (excluding high income)Middle East & North Africa (IDA & IBRD countries)Middle incomeMoldovaMongoliaMontenegroMoroccoMozambiqueMyanmarNamibiaNepalNetherlandsNew CaledoniaNew ZealandNicaraguaNigerNigeriaNorth AmericaNorwayOECD membersOmanOther small statesPacific island small statesPakistanPanamaPapua New GuineaParaguayPeruPhilippinesPolandPortugalPost-demographic dividendPre-demographic dividendPuerto RicoQatarRomaniaRussian FederationRwandaSamoaSao Tome and PrincipeSaudi ArabiaSenegalSerbiaSeychellesSierra LeoneSingaporeSlovak RepublicSloveniaSmall statesSolomon IslandsSomaliaSouth AfricaSouth AsiaSouth Asia (IDA & IBRD)South SudanSpainSri LankaSt. LuciaSt. Vincent and the GrenadinesSub-Saharan Africa Sub-Saharan Africa (excluding high income)Sub-Saharan Africa (IDA & IBRD countries)SudanSurinameSwazilandSwedenSwitzerlandSyrian Arab RepublicTajikistanTanzaniaThailandTimor-LesteTogoTongaTrinidad and TobagoTunisiaTurkeyTurkmenistanUgandaUkraineUnited Arab EmiratesUnited KingdomUnited StatesUpper middle incomeUruguayUzbekistanVanuatuVenezuela, RBVietnamVirgin Islands (U.S.)West Bank and GazaWorldYemen, Rep.ZambiaZimbabwe Timeline:
This timeline shows a graph from 1961 to 2016 of Yemen, Rep.. No data until 1960. Number of actual observations by date: 56.
Source name:
World Development Indicators
Source organization:
World Bank staff estimates based on age distributions of United Nations Population Division's World Population Prospects.
Categories, topics:
Education, Health
Last updated:
apr 23, 2017
Indicators value changes by year
Minimum:
45.708
jan 1, 1991
Maximum:
56.949
jan 1, 2016
At the date of observation
Value
Absolute change
Change from previous value
jan 1, 1961
54.102
+54.102
0.0%
jan 1, 1962
53.998
-0.104
-0.19%
jan 1, 1963
54.098
+0.1
0.19%
jan 1, 1964
54.312
+0.214
0.4%
jan 1, 1965
54.506
+0.194
0.36%
jan 1, 1966
54.607
+0.101
0.19%
jan 1, 1967
54.268
-0.34
-0.62%
jan 1, 1968
53.846
-0.422
-0.78%
jan 1, 1969
53.37
-0.476
-0.88%
jan 1, 1970
52.914
-0.456
-0.85%
jan 1, 1971
52.524
-0.39
-0.74%
jan 1, 1972
51.795
-0.729
-1.39%
jan 1, 1973
51.195
-0.599
-1.16%
jan 1, 1974
50.666
-0.529
-1.03%
jan 1, 1975
50.126
-0.54
-1.07%
jan 1, 1976
49.541
-0.585
-1.17%
jan 1, 1977
49.153
-0.389
-0.78%
jan 1, 1978
48.739
-0.414
-0.84%
jan 1, 1979
48.336
-0.403
-0.83%
jan 1, 1980
48.003
-0.333
-0.69%
jan 1, 1981
47.759
-0.244
-0.51%
jan 1, 1982
47.394
-0.365
-0.76%
jan 1, 1983
47.156
-0.238
-0.5%
jan 1, 1984
46.993
-0.163
-0.35%
jan 1, 1985
46.841
-0.153
-0.32%
jan 1, 1986
46.674
-0.167
-0.36%
jan 1, 1987
46.409
-0.265
-0.57%
jan 1, 1988
46.172
-0.236
-0.51%
jan 1, 1989
45.971
-0.202
-0.44%
jan 1, 1990
45.815
-0.155
-0.34%
jan 1, 1991
45.708
-0.107
-0.23%
jan 1, 1992
45.811
+0.102
0.22%
jan 1, 1993
45.921
+0.11
0.24%
jan 1, 1994
46.077
+0.156
0.34%
jan 1, 1995
46.318
+0.241
0.52%
jan 1, 1996
46.663
+0.345
0.74%
jan 1, 1997
46.793
+0.13
0.28%
jan 1, 1998
47.107
+0.314
0.67%
jan 1, 1999
47.554
+0.447
0.95%
jan 1, 2000
48.066
+0.512
1.08%
jan 1, 2001
48.606
+0.54
1.12%
jan 1, 2002
49.23
+0.624
1.28%
jan 1, 2003
49.809
+0.579
1.18%
jan 1, 2004
50.387
+0.578
1.16%
jan 1, 2005
51.024
+0.637
1.26%
jan 1, 2006
51.732
+0.709
1.39%
jan 1, 2007
52.364
+0.632
1.22%
jan 1, 2008
53.068
+0.703
1.34%
jan 1, 2009
53.792
+0.725
1.37%
jan 1, 2010
54.468
+0.675
1.26%
jan 1, 2011
55.062
+0.594
1.09%
jan 1, 2012
55.496
+0.434
0.79%
jan 1, 2013
55.896
+0.401
0.72%
jan 1, 2014
56.264
+0.367
0.66%
jan 1, 2015
56.611
+0.347
0.62%
jan 1, 2016
56.949
+0.338
0.6%
Ranking of countries by current statistics by years


Comments: