29
/
en
AIzaSyAYiBZKx7MnpbEhh9jyipgxe19OcubqV5w
April 1, 2024
267281
Trinidad and Tobago
TTO
true
2
1
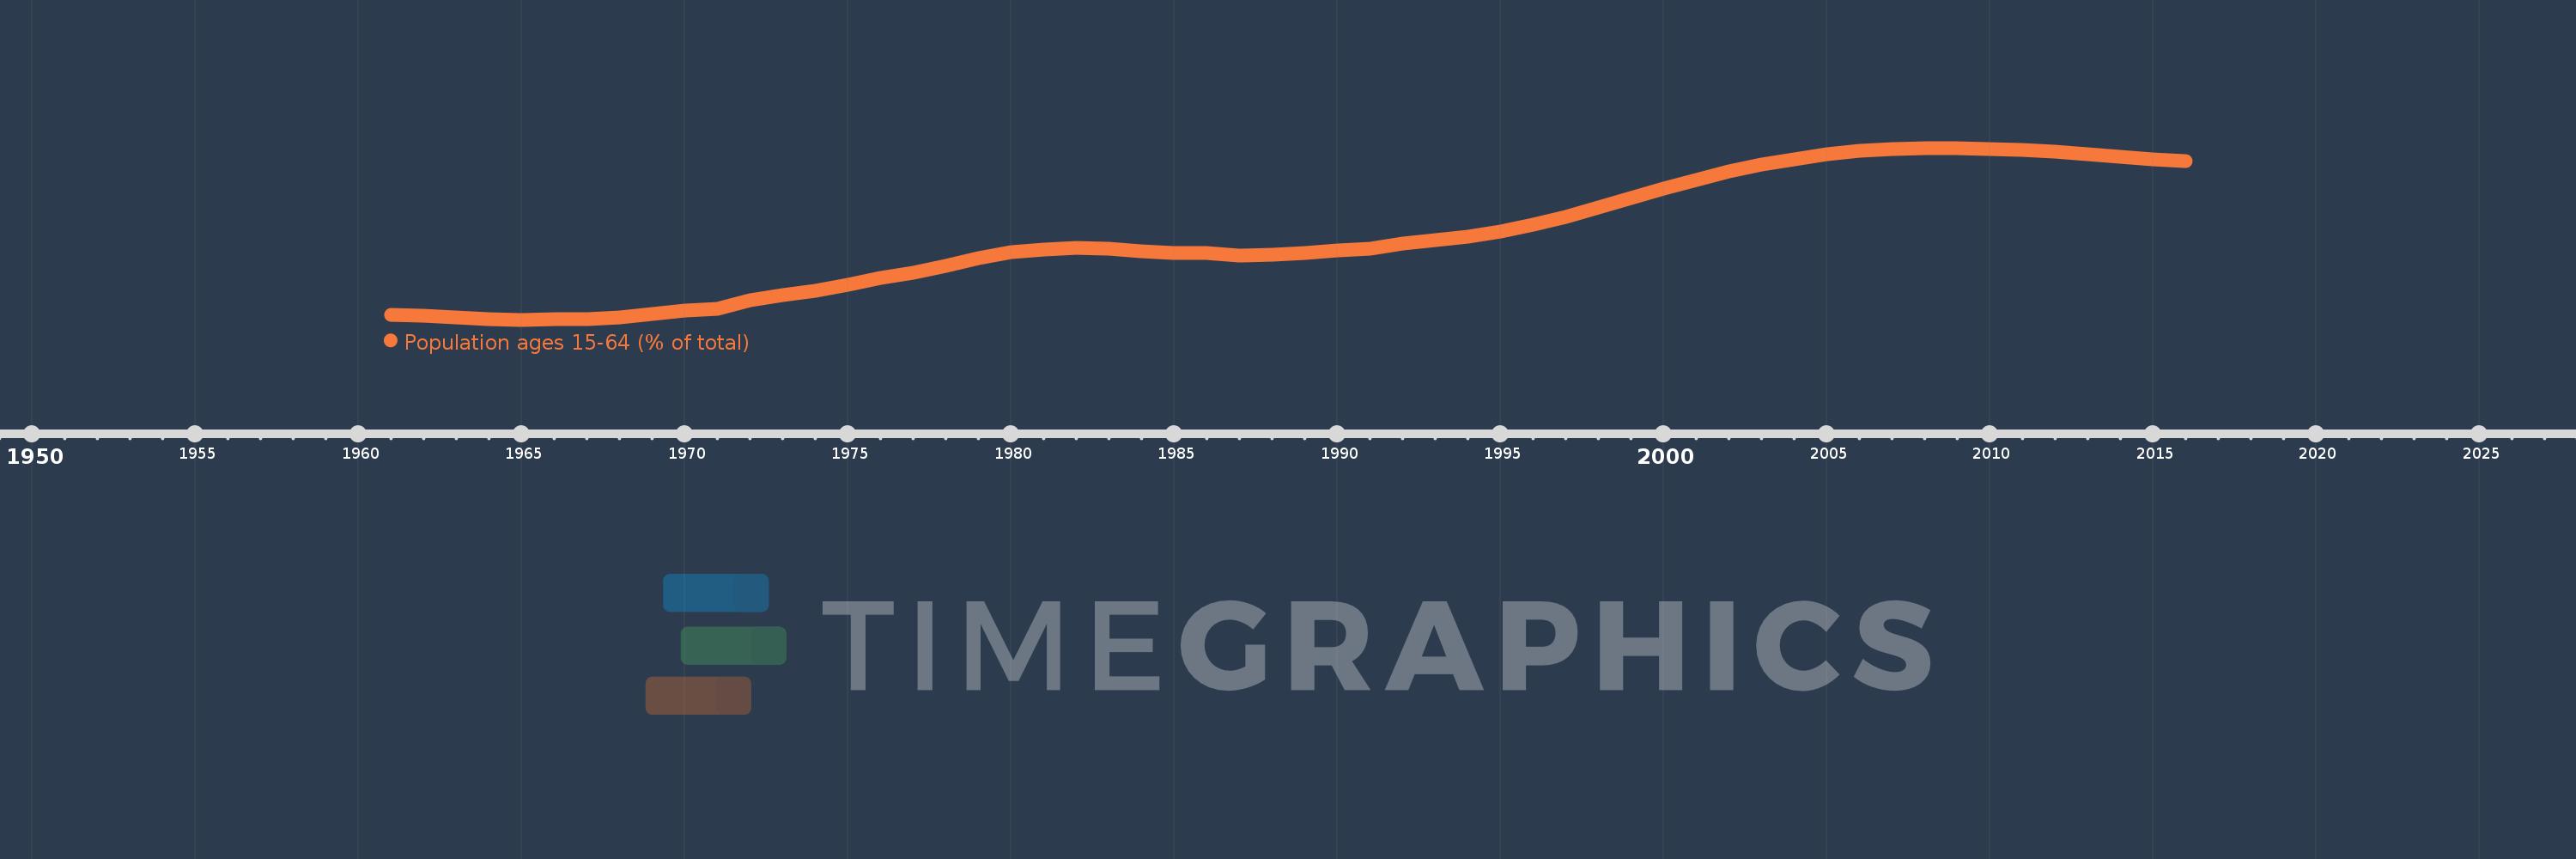
Population ages 15-64 (% of total)
2016,2015,2014,2013,2012,2011,2010,2009,2008,2007,2006,2005,2004,2003,2002,2001,2000,1999,1998,1997,1996,1995,1994,1993,1992,1991,1990,1989,1988,1987,1986,1985,1984,1983,1982,1981,1980,1979,1978,1977,1976,1975,1974,1973,1972,1971,1970,1969,1968,1967,1966,1965,1964,1963,1962,1961
This statistics in other country:
AfghanistanAlbaniaAlgeriaAngolaAntigua and BarbudaArab WorldArgentinaArmeniaArubaAustraliaAustriaAzerbaijanBahamas, TheBahrainBangladeshBarbadosBelarusBelgiumBelizeBeninBhutanBoliviaBosnia and HerzegovinaBotswanaBrazilBrunei DarussalamBulgariaBurkina FasoBurundiCabo VerdeCambodiaCameroonCanadaCaribbean small statesCentral African RepublicCentral Europe and the BalticsChadChannel IslandsChileChinaColombiaComorosCongo, Dem. Rep.Congo, Rep.Costa RicaCote d'IvoireCroatiaCubaCuracaoCyprusCzech RepublicDenmarkDjiboutiDominican RepublicEarly-demographic dividendEast Asia & PacificEast Asia & Pacific (excluding high income)East Asia & Pacific (IDA & IBRD countries)EcuadorEgypt, Arab Rep.El SalvadorEquatorial GuineaEritreaEstoniaEthiopiaEuro areaEurope & Central AsiaEurope & Central Asia (excluding high income)Europe & Central Asia (IDA & IBRD countries)European UnionFijiFinlandFragile and conflict affected situationsFranceFrench PolynesiaGabonGambia, TheGeorgiaGermanyGhanaGreeceGrenadaGuamGuatemalaGuineaGuinea-BissauGuyanaHaitiHeavily indebted poor countries (HIPC)High incomeHondurasHong Kong SAR, ChinaHungaryIBRD onlyIcelandIDA & IBRD totalIDA blendIDA onlyIDA totalIndiaIndonesiaIran, Islamic Rep.IraqIrelandIsraelItalyJamaicaJapanJordanKazakhstanKenyaKiribatiKorea, Dem. People’s Rep.Korea, Rep.KosovoKuwaitKyrgyz RepublicLao PDRLate-demographic dividendLatin America & Caribbean Latin America & Caribbean (excluding high income)Latin America & the Caribbean (IDA & IBRD countries)LatviaLeast developed countries: UN classificationLebanonLesothoLiberiaLibyaLithuaniaLow & middle incomeLow incomeLower middle incomeLuxembourgMacao SAR, ChinaMacedonia, FYRMadagascarMalawiMalaysiaMaldivesMaliMaltaMauritaniaMauritiusMexicoMicronesia, Fed. Sts.Middle East & North AfricaMiddle East & North Africa (excluding high income)Middle East & North Africa (IDA & IBRD countries)Middle incomeMoldovaMongoliaMontenegroMoroccoMozambiqueMyanmarNamibiaNepalNetherlandsNew CaledoniaNew ZealandNicaraguaNigerNigeriaNorth AmericaNorwayOECD membersOmanOther small statesPacific island small statesPakistanPanamaPapua New GuineaParaguayPeruPhilippinesPolandPortugalPost-demographic dividendPre-demographic dividendPuerto RicoQatarRomaniaRussian FederationRwandaSamoaSao Tome and PrincipeSaudi ArabiaSenegalSerbiaSeychellesSierra LeoneSingaporeSlovak RepublicSloveniaSmall statesSolomon IslandsSomaliaSouth AfricaSouth AsiaSouth Asia (IDA & IBRD)South SudanSpainSri LankaSt. LuciaSt. Vincent and the GrenadinesSub-Saharan Africa Sub-Saharan Africa (excluding high income)Sub-Saharan Africa (IDA & IBRD countries)SudanSurinameSwazilandSwedenSwitzerlandSyrian Arab RepublicTajikistanTanzaniaThailandTimor-LesteTogoTongaTrinidad and TobagoTunisiaTurkeyTurkmenistanUgandaUkraineUnited Arab EmiratesUnited KingdomUnited StatesUpper middle incomeUruguayUzbekistanVanuatuVenezuela, RBVietnamVirgin Islands (U.S.)West Bank and GazaWorldYemen, Rep.ZambiaZimbabwe Timeline:
This timeline shows a graph from 1961 to 2016 of Trinidad and Tobago. No data until 1960. Number of actual observations by date: 56.
Source name:
World Development Indicators
Source organization:
World Bank staff estimates based on age distributions of United Nations Population Division's World Population Prospects.
Categories, topics:
Education, Health
Last updated:
apr 23, 2017
Indicators value changes by year
Minimum:
53.162
jan 1, 1965
Maximum:
71.223
jan 1, 2009
At the date of observation
Value
Absolute change
Change from previous value
jan 1, 1961
53.669
+53.669
0.0%
jan 1, 1962
53.56
-0.109
-0.2%
jan 1, 1963
53.411
-0.149
-0.28%
jan 1, 1964
53.25
-0.16
-0.3%
jan 1, 1965
53.162
-0.089
-0.17%
jan 1, 1966
53.214
+0.052
0.1%
jan 1, 1967
53.189
-0.024
-0.05%
jan 1, 1968
53.403
+0.214
0.4%
jan 1, 1969
53.755
+0.351
0.66%
jan 1, 1970
54.092
+0.337
0.63%
jan 1, 1971
54.347
+0.256
0.47%
jan 1, 1972
55.181
+0.833
1.53%
jan 1, 1973
55.766
+0.585
1.06%
jan 1, 1974
56.24
+0.474
0.85%
jan 1, 1975
56.798
+0.559
0.99%
jan 1, 1976
57.515
+0.716
1.26%
jan 1, 1977
58.057
+0.543
0.94%
jan 1, 1978
58.804
+0.746
1.29%
jan 1, 1979
59.605
+0.801
1.36%
jan 1, 1980
60.226
+0.622
1.04%
jan 1, 1981
60.562
+0.336
0.56%
jan 1, 1982
60.73
+0.168
0.28%
jan 1, 1983
60.637
-0.092
-0.15%
jan 1, 1984
60.394
-0.243
-0.4%
jan 1, 1985
60.197
-0.197
-0.33%
jan 1, 1986
60.157
-0.04
-0.07%
jan 1, 1987
59.93
-0.227
-0.38%
jan 1, 1988
59.958
+0.028
0.05%
jan 1, 1989
60.165
+0.207
0.34%
jan 1, 1990
60.415
+0.25
0.42%
jan 1, 1991
60.652
+0.236
0.39%
jan 1, 1992
61.15
+0.498
0.82%
jan 1, 1993
61.543
+0.393
0.64%
jan 1, 1994
61.928
+0.385
0.62%
jan 1, 1995
62.449
+0.521
0.84%
jan 1, 1996
63.168
+0.719
1.15%
jan 1, 1997
63.979
+0.812
1.29%
jan 1, 1998
64.935
+0.955
1.49%
jan 1, 1999
65.978
+1.044
1.61%
jan 1, 2000
66.99
+1.012
1.53%
jan 1, 2001
67.891
+0.901
1.34%
jan 1, 2002
68.727
+0.836
1.23%
jan 1, 2003
69.449
+0.722
1.05%
jan 1, 2004
70.049
+0.6
0.86%
jan 1, 2005
70.537
+0.489
0.7%
jan 1, 2006
70.92
+0.383
0.54%
jan 1, 2007
71.11
+0.19
0.27%
jan 1, 2008
71.213
+0.103
0.14%
jan 1, 2009
71.223
+0.01
0.01%
jan 1, 2010
71.143
-0.08
-0.11%
jan 1, 2011
70.985
-0.158
-0.22%
jan 1, 2012
70.793
-0.192
-0.27%
jan 1, 2013
70.565
-0.229
-0.32%
jan 1, 2014
70.311
-0.254
-0.36%
jan 1, 2015
70.054
-0.257
-0.37%
jan 1, 2016
69.808
-0.245
-0.35%
Ranking of countries by current statistics by years


Comments: