29
/
en
AIzaSyAYiBZKx7MnpbEhh9jyipgxe19OcubqV5w
April 1, 2024
224085
Philippines
PHL
true
2
1
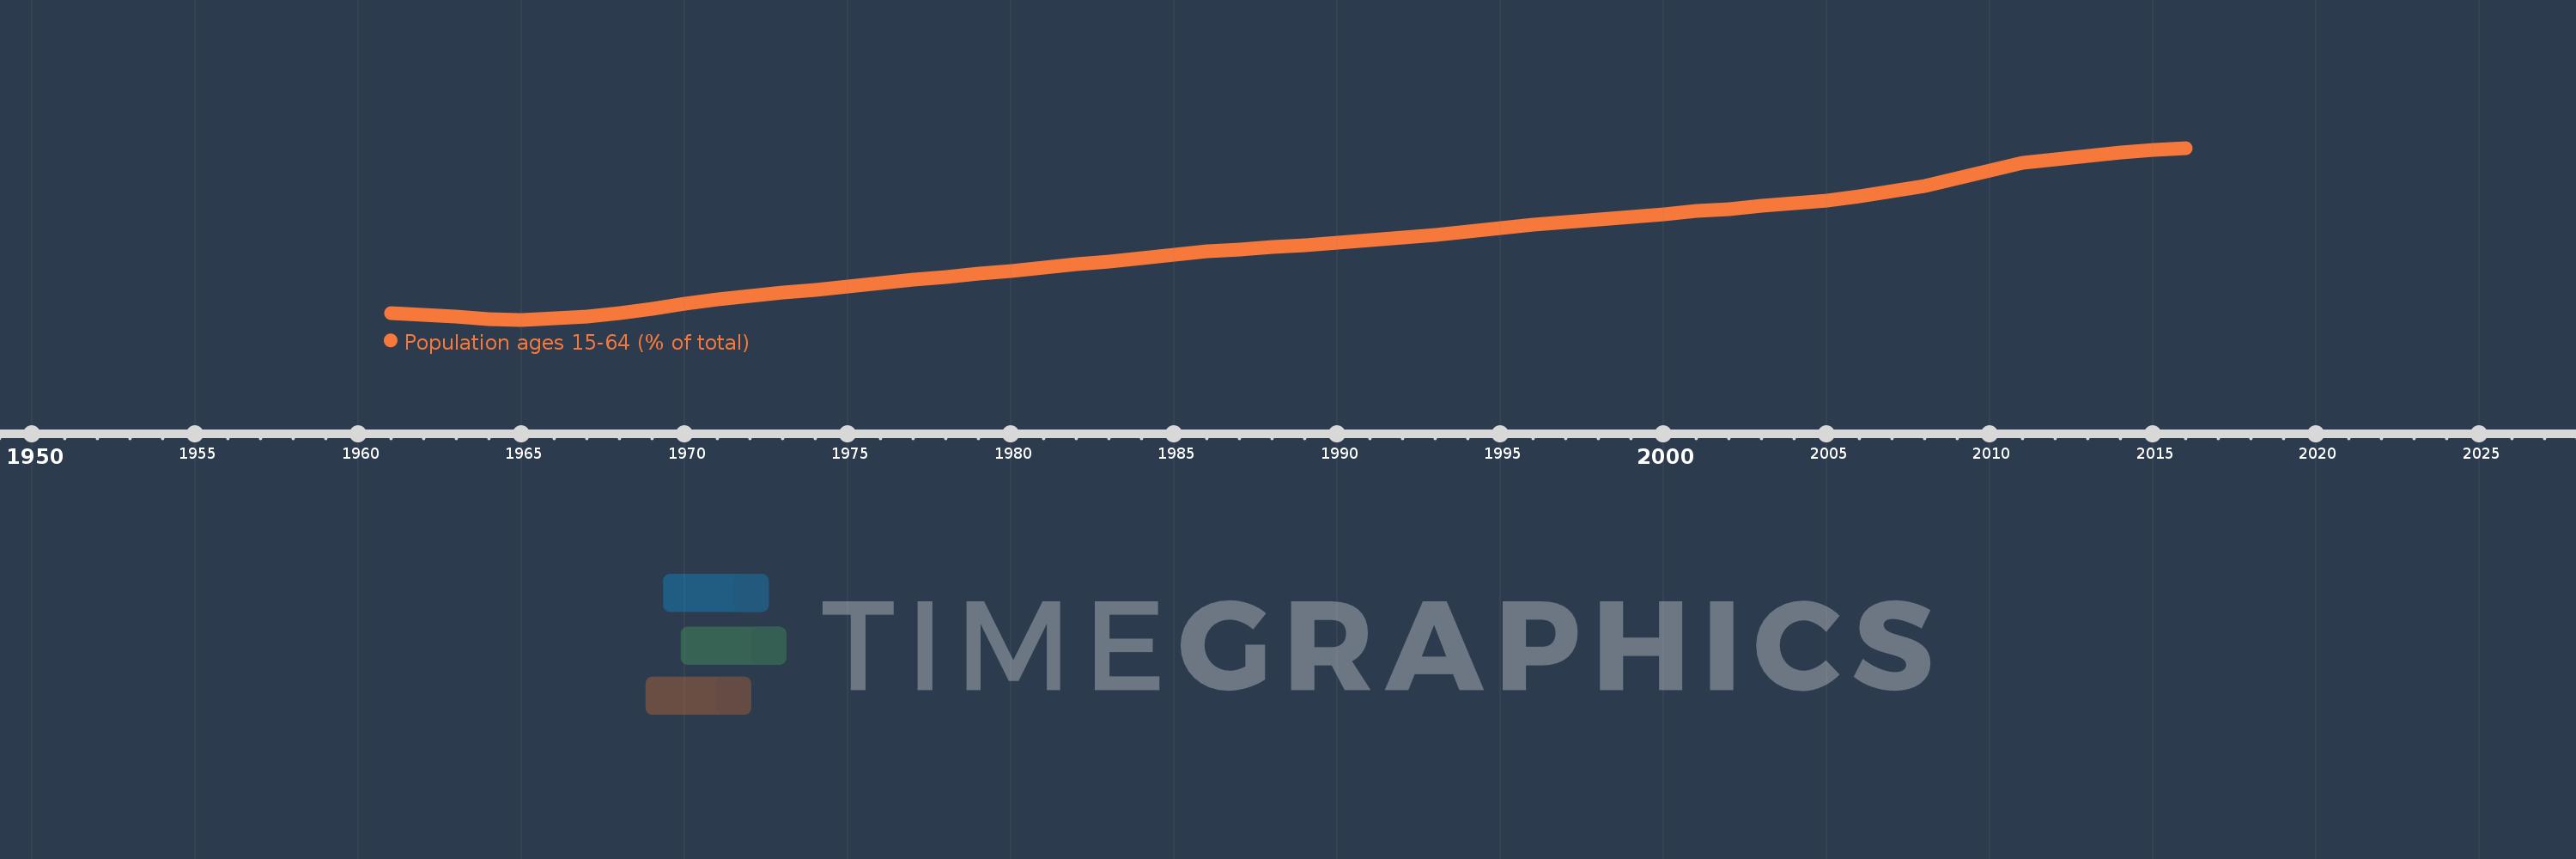
Population ages 15-64 (% of total)
2016,2015,2014,2013,2012,2011,2010,2009,2008,2007,2006,2005,2004,2003,2002,2001,2000,1999,1998,1997,1996,1995,1994,1993,1992,1991,1990,1989,1988,1987,1986,1985,1984,1983,1982,1981,1980,1979,1978,1977,1976,1975,1974,1973,1972,1971,1970,1969,1968,1967,1966,1965,1964,1963,1962,1961
This statistics in other country:
AfghanistanAlbaniaAlgeriaAngolaAntigua and BarbudaArab WorldArgentinaArmeniaArubaAustraliaAustriaAzerbaijanBahamas, TheBahrainBangladeshBarbadosBelarusBelgiumBelizeBeninBhutanBoliviaBosnia and HerzegovinaBotswanaBrazilBrunei DarussalamBulgariaBurkina FasoBurundiCabo VerdeCambodiaCameroonCanadaCaribbean small statesCentral African RepublicCentral Europe and the BalticsChadChannel IslandsChileChinaColombiaComorosCongo, Dem. Rep.Congo, Rep.Costa RicaCote d'IvoireCroatiaCubaCuracaoCyprusCzech RepublicDenmarkDjiboutiDominican RepublicEarly-demographic dividendEast Asia & PacificEast Asia & Pacific (excluding high income)East Asia & Pacific (IDA & IBRD countries)EcuadorEgypt, Arab Rep.El SalvadorEquatorial GuineaEritreaEstoniaEthiopiaEuro areaEurope & Central AsiaEurope & Central Asia (excluding high income)Europe & Central Asia (IDA & IBRD countries)European UnionFijiFinlandFragile and conflict affected situationsFranceFrench PolynesiaGabonGambia, TheGeorgiaGermanyGhanaGreeceGrenadaGuamGuatemalaGuineaGuinea-BissauGuyanaHaitiHeavily indebted poor countries (HIPC)High incomeHondurasHong Kong SAR, ChinaHungaryIBRD onlyIcelandIDA & IBRD totalIDA blendIDA onlyIDA totalIndiaIndonesiaIran, Islamic Rep.IraqIrelandIsraelItalyJamaicaJapanJordanKazakhstanKenyaKiribatiKorea, Dem. People’s Rep.Korea, Rep.KosovoKuwaitKyrgyz RepublicLao PDRLate-demographic dividendLatin America & Caribbean Latin America & Caribbean (excluding high income)Latin America & the Caribbean (IDA & IBRD countries)LatviaLeast developed countries: UN classificationLebanonLesothoLiberiaLibyaLithuaniaLow & middle incomeLow incomeLower middle incomeLuxembourgMacao SAR, ChinaMacedonia, FYRMadagascarMalawiMalaysiaMaldivesMaliMaltaMauritaniaMauritiusMexicoMicronesia, Fed. Sts.Middle East & North AfricaMiddle East & North Africa (excluding high income)Middle East & North Africa (IDA & IBRD countries)Middle incomeMoldovaMongoliaMontenegroMoroccoMozambiqueMyanmarNamibiaNepalNetherlandsNew CaledoniaNew ZealandNicaraguaNigerNigeriaNorth AmericaNorwayOECD membersOmanOther small statesPacific island small statesPakistanPanamaPapua New GuineaParaguayPeruPhilippinesPolandPortugalPost-demographic dividendPre-demographic dividendPuerto RicoQatarRomaniaRussian FederationRwandaSamoaSao Tome and PrincipeSaudi ArabiaSenegalSerbiaSeychellesSierra LeoneSingaporeSlovak RepublicSloveniaSmall statesSolomon IslandsSomaliaSouth AfricaSouth AsiaSouth Asia (IDA & IBRD)South SudanSpainSri LankaSt. LuciaSt. Vincent and the GrenadinesSub-Saharan Africa Sub-Saharan Africa (excluding high income)Sub-Saharan Africa (IDA & IBRD countries)SudanSurinameSwazilandSwedenSwitzerlandSyrian Arab RepublicTajikistanTanzaniaThailandTimor-LesteTogoTongaTrinidad and TobagoTunisiaTurkeyTurkmenistanUgandaUkraineUnited Arab EmiratesUnited KingdomUnited StatesUpper middle incomeUruguayUzbekistanVanuatuVenezuela, RBVietnamVirgin Islands (U.S.)West Bank and GazaWorldYemen, Rep.ZambiaZimbabwe Timeline:
This timeline shows a graph from 1961 to 2016 of Philippines. No data until 1960. Number of actual observations by date: 56.
Source name:
World Development Indicators
Source organization:
World Bank staff estimates based on age distributions of United Nations Population Division's World Population Prospects.
Categories, topics:
Education, Health
Last updated:
apr 23, 2017
Indicators value changes by year
Minimum:
49.373
jan 1, 1965
Maximum:
63.472
jan 1, 2016
At the date of observation
Value
Absolute change
Change from previous value
jan 1, 1961
49.89
+49.89
0.0%
jan 1, 1962
49.801
-0.089
-0.18%
jan 1, 1963
49.609
-0.192
-0.39%
jan 1, 1964
49.419
-0.19
-0.38%
jan 1, 1965
49.373
-0.046
-0.09%
jan 1, 1966
49.525
+0.152
0.31%
jan 1, 1967
49.619
+0.094
0.19%
jan 1, 1968
49.888
+0.269
0.54%
jan 1, 1969
50.269
+0.381
0.76%
jan 1, 1970
50.661
+0.392
0.78%
jan 1, 1971
51.014
+0.353
0.7%
jan 1, 1972
51.301
+0.288
0.56%
jan 1, 1973
51.574
+0.273
0.53%
jan 1, 1974
51.839
+0.264
0.51%
jan 1, 1975
52.113
+0.274
0.53%
jan 1, 1976
52.405
+0.292
0.56%
jan 1, 1977
52.641
+0.236
0.45%
jan 1, 1978
52.882
+0.241
0.46%
jan 1, 1979
53.133
+0.251
0.47%
jan 1, 1980
53.397
+0.264
0.5%
jan 1, 1981
53.676
+0.279
0.52%
jan 1, 1982
53.905
+0.229
0.43%
jan 1, 1983
54.169
+0.264
0.49%
jan 1, 1984
54.448
+0.279
0.52%
jan 1, 1985
54.719
+0.271
0.5%
jan 1, 1986
54.971
+0.252
0.46%
jan 1, 1987
55.158
+0.187
0.34%
jan 1, 1988
55.323
+0.166
0.3%
jan 1, 1989
55.488
+0.164
0.3%
jan 1, 1990
55.681
+0.193
0.35%
jan 1, 1991
55.919
+0.238
0.43%
jan 1, 1992
56.099
+0.18
0.32%
jan 1, 1993
56.339
+0.24
0.43%
jan 1, 1994
56.615
+0.276
0.49%
jan 1, 1995
56.891
+0.277
0.49%
jan 1, 1996
57.153
+0.262
0.46%
jan 1, 1997
57.383
+0.23
0.4%
jan 1, 1998
57.591
+0.207
0.36%
jan 1, 1999
57.796
+0.206
0.36%
jan 1, 2000
58.023
+0.226
0.39%
jan 1, 2001
58.274
+0.251
0.43%
jan 1, 2002
58.476
+0.202
0.35%
jan 1, 2003
58.695
+0.218
0.37%
jan 1, 2004
58.924
+0.229
0.39%
jan 1, 2005
59.174
+0.25
0.42%
jan 1, 2006
59.478
+0.304
0.51%
jan 1, 2007
59.898
+0.42
0.71%
jan 1, 2008
60.382
+0.484
0.81%
jan 1, 2009
60.965
+0.583
0.97%
jan 1, 2010
61.611
+0.646
1.06%
jan 1, 2011
62.236
+0.625
1.01%
jan 1, 2012
62.533
+0.297
0.48%
jan 1, 2013
62.819
+0.286
0.46%
jan 1, 2014
63.068
+0.249
0.4%
jan 1, 2015
63.28
+0.212
0.34%
jan 1, 2016
63.472
+0.192
0.3%
Ranking of countries by current statistics by years


Comments: