29
/
en
AIzaSyAYiBZKx7MnpbEhh9jyipgxe19OcubqV5w
April 1, 2024
210874
Nicaragua
NIC
true
2
1
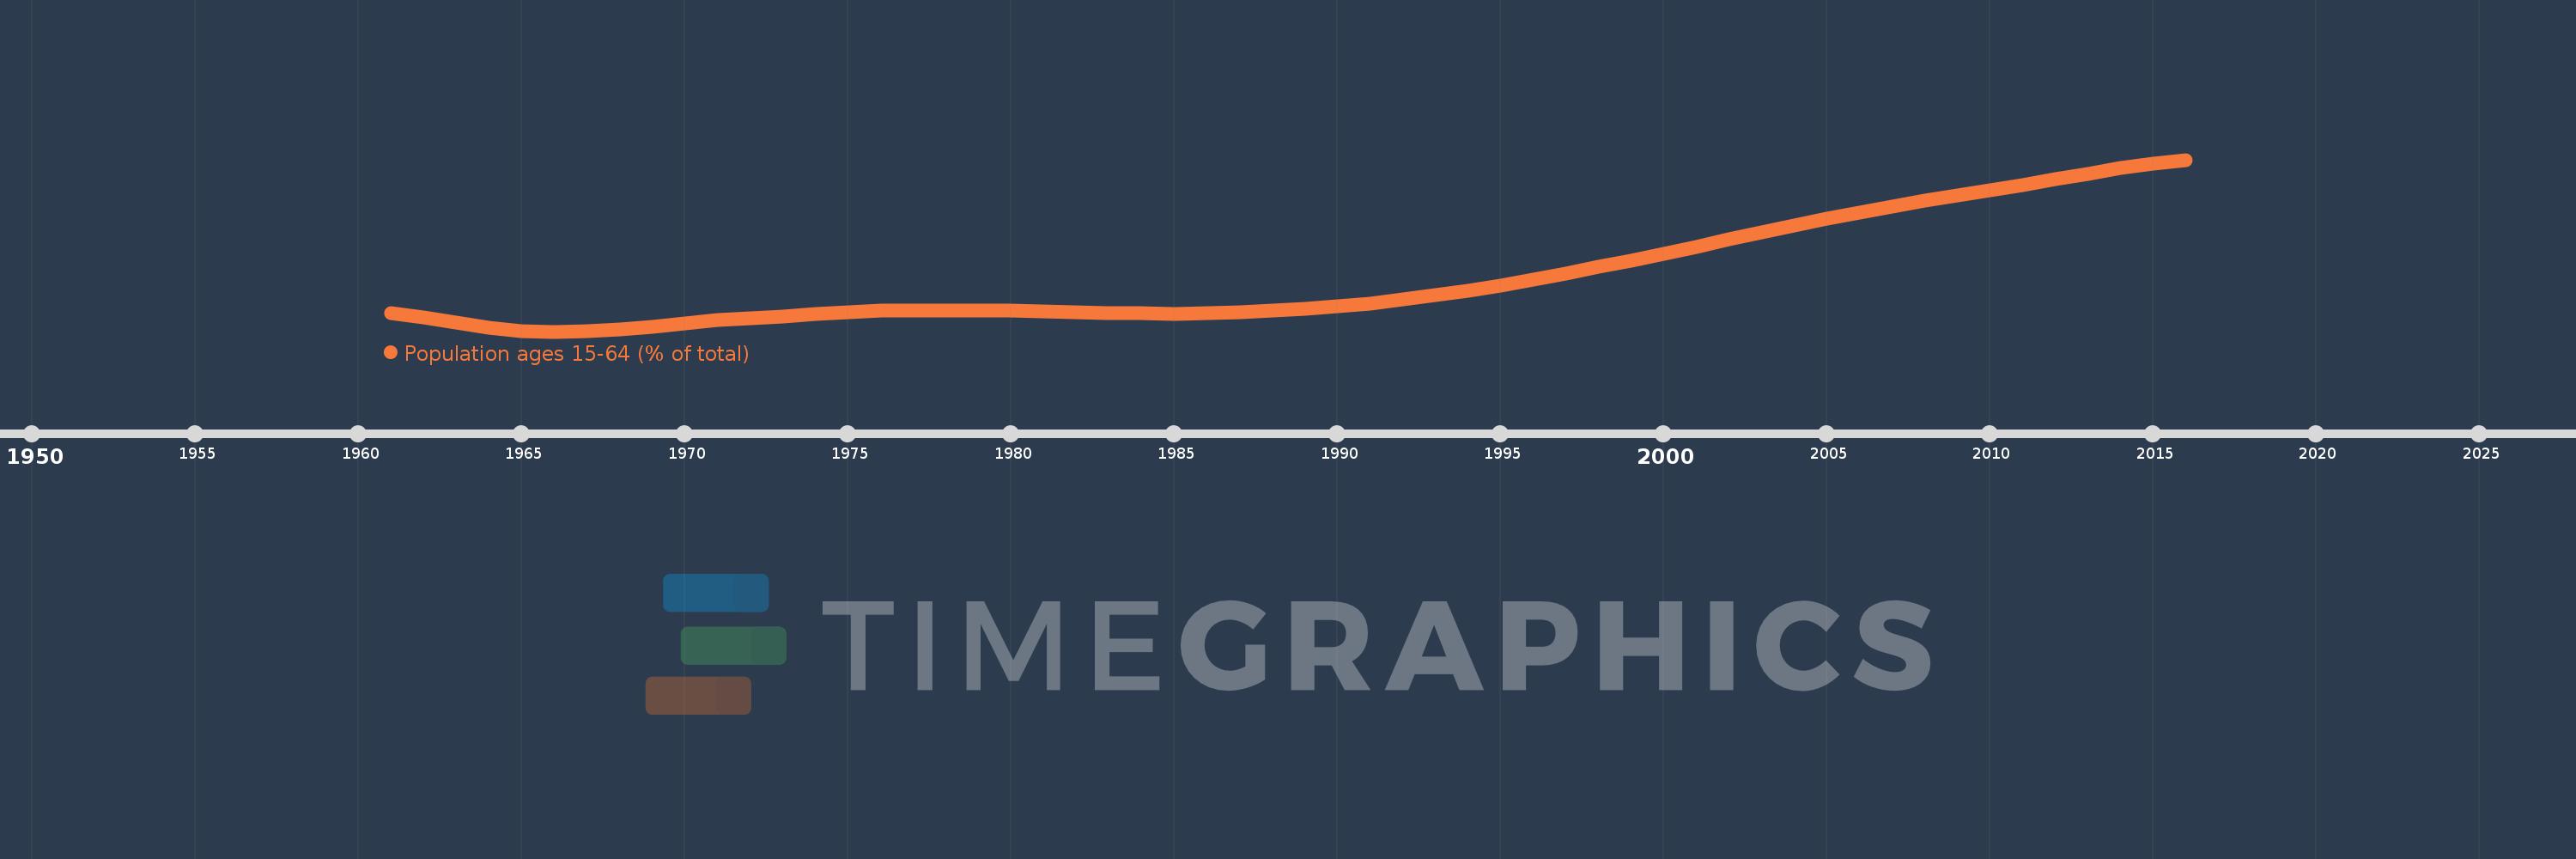
Population ages 15-64 (% of total)
2016,2015,2014,2013,2012,2011,2010,2009,2008,2007,2006,2005,2004,2003,2002,2001,2000,1999,1998,1997,1996,1995,1994,1993,1992,1991,1990,1989,1988,1987,1986,1985,1984,1983,1982,1981,1980,1979,1978,1977,1976,1975,1974,1973,1972,1971,1970,1969,1968,1967,1966,1965,1964,1963,1962,1961
This statistics in other country:
AfghanistanAlbaniaAlgeriaAngolaAntigua and BarbudaArab WorldArgentinaArmeniaArubaAustraliaAustriaAzerbaijanBahamas, TheBahrainBangladeshBarbadosBelarusBelgiumBelizeBeninBhutanBoliviaBosnia and HerzegovinaBotswanaBrazilBrunei DarussalamBulgariaBurkina FasoBurundiCabo VerdeCambodiaCameroonCanadaCaribbean small statesCentral African RepublicCentral Europe and the BalticsChadChannel IslandsChileChinaColombiaComorosCongo, Dem. Rep.Congo, Rep.Costa RicaCote d'IvoireCroatiaCubaCuracaoCyprusCzech RepublicDenmarkDjiboutiDominican RepublicEarly-demographic dividendEast Asia & PacificEast Asia & Pacific (excluding high income)East Asia & Pacific (IDA & IBRD countries)EcuadorEgypt, Arab Rep.El SalvadorEquatorial GuineaEritreaEstoniaEthiopiaEuro areaEurope & Central AsiaEurope & Central Asia (excluding high income)Europe & Central Asia (IDA & IBRD countries)European UnionFijiFinlandFragile and conflict affected situationsFranceFrench PolynesiaGabonGambia, TheGeorgiaGermanyGhanaGreeceGrenadaGuamGuatemalaGuineaGuinea-BissauGuyanaHaitiHeavily indebted poor countries (HIPC)High incomeHondurasHong Kong SAR, ChinaHungaryIBRD onlyIcelandIDA & IBRD totalIDA blendIDA onlyIDA totalIndiaIndonesiaIran, Islamic Rep.IraqIrelandIsraelItalyJamaicaJapanJordanKazakhstanKenyaKiribatiKorea, Dem. People’s Rep.Korea, Rep.KosovoKuwaitKyrgyz RepublicLao PDRLate-demographic dividendLatin America & Caribbean Latin America & Caribbean (excluding high income)Latin America & the Caribbean (IDA & IBRD countries)LatviaLeast developed countries: UN classificationLebanonLesothoLiberiaLibyaLithuaniaLow & middle incomeLow incomeLower middle incomeLuxembourgMacao SAR, ChinaMacedonia, FYRMadagascarMalawiMalaysiaMaldivesMaliMaltaMauritaniaMauritiusMexicoMicronesia, Fed. Sts.Middle East & North AfricaMiddle East & North Africa (excluding high income)Middle East & North Africa (IDA & IBRD countries)Middle incomeMoldovaMongoliaMontenegroMoroccoMozambiqueMyanmarNamibiaNepalNetherlandsNew CaledoniaNew ZealandNicaraguaNigerNigeriaNorth AmericaNorwayOECD membersOmanOther small statesPacific island small statesPakistanPanamaPapua New GuineaParaguayPeruPhilippinesPolandPortugalPost-demographic dividendPre-demographic dividendPuerto RicoQatarRomaniaRussian FederationRwandaSamoaSao Tome and PrincipeSaudi ArabiaSenegalSerbiaSeychellesSierra LeoneSingaporeSlovak RepublicSloveniaSmall statesSolomon IslandsSomaliaSouth AfricaSouth AsiaSouth Asia (IDA & IBRD)South SudanSpainSri LankaSt. LuciaSt. Vincent and the GrenadinesSub-Saharan Africa Sub-Saharan Africa (excluding high income)Sub-Saharan Africa (IDA & IBRD countries)SudanSurinameSwazilandSwedenSwitzerlandSyrian Arab RepublicTajikistanTanzaniaThailandTimor-LesteTogoTongaTrinidad and TobagoTunisiaTurkeyTurkmenistanUgandaUkraineUnited Arab EmiratesUnited KingdomUnited StatesUpper middle incomeUruguayUzbekistanVanuatuVenezuela, RBVietnamVirgin Islands (U.S.)West Bank and GazaWorldYemen, Rep.ZambiaZimbabwe Timeline:
This timeline shows a graph from 1961 to 2016 of Nicaragua. No data until 1960. Number of actual observations by date: 56.
Source name:
World Development Indicators
Source organization:
World Bank staff estimates based on age distributions of United Nations Population Division's World Population Prospects.
Categories, topics:
Education, Health
Last updated:
apr 23, 2017
Indicators value changes by year
Minimum:
48.352
jan 1, 1966
At the date of observation
Value
Absolute change
Change from previous value
jan 1, 1961
50.112
+50.112
0.0%
jan 1, 1962
49.691
-0.421
-0.84%
jan 1, 1963
49.203
-0.489
-0.98%
jan 1, 1964
48.736
-0.466
-0.95%
jan 1, 1965
48.433
-0.303
-0.62%
jan 1, 1966
48.352
-0.082
-0.17%
jan 1, 1967
48.372
+0.02
0.04%
jan 1, 1968
48.523
+0.151
0.31%
jan 1, 1969
48.784
+0.26
0.54%
jan 1, 1970
49.102
+0.319
0.65%
jan 1, 1971
49.439
+0.337
0.69%
jan 1, 1972
49.618
+0.179
0.36%
jan 1, 1973
49.834
+0.216
0.44%
jan 1, 1974
50.054
+0.22
0.44%
jan 1, 1975
50.247
+0.192
0.38%
jan 1, 1976
50.4
+0.153
0.3%
jan 1, 1977
50.385
-0.015
-0.03%
jan 1, 1978
50.374
-0.011
-0.02%
jan 1, 1979
50.358
-0.016
-0.03%
jan 1, 1980
50.339
-0.02
-0.04%
jan 1, 1981
50.324
-0.014
-0.03%
jan 1, 1982
50.244
-0.08
-0.16%
jan 1, 1983
50.159
-0.086
-0.17%
jan 1, 1984
50.09
-0.068
-0.14%
jan 1, 1985
50.073
-0.017
-0.03%
jan 1, 1986
50.127
+0.054
0.11%
jan 1, 1987
50.194
+0.067
0.13%
jan 1, 1988
50.341
+0.147
0.29%
jan 1, 1989
50.548
+0.207
0.41%
jan 1, 1990
50.789
+0.241
0.48%
jan 1, 1991
51.054
+0.265
0.52%
jan 1, 1992
51.448
+0.394
0.77%
jan 1, 1993
51.862
+0.414
0.8%
jan 1, 1994
52.304
+0.443
0.85%
jan 1, 1995
52.793
+0.489
0.93%
jan 1, 1996
53.336
+0.543
1.03%
jan 1, 1997
53.931
+0.595
1.12%
jan 1, 1998
54.557
+0.626
1.16%
jan 1, 1999
55.207
+0.65
1.19%
jan 1, 2000
55.868
+0.661
1.2%
jan 1, 2001
56.532
+0.664
1.19%
jan 1, 2002
57.215
+0.683
1.21%
jan 1, 2003
57.892
+0.678
1.18%
jan 1, 2004
58.554
+0.661
1.14%
jan 1, 2005
59.182
+0.628
1.07%
jan 1, 2006
59.766
+0.584
0.99%
jan 1, 2007
60.396
+0.63
1.05%
jan 1, 2008
60.956
+0.561
0.93%
jan 1, 2009
61.47
+0.513
0.84%
jan 1, 2010
61.971
+0.501
0.82%
jan 1, 2011
62.477
+0.506
0.82%
jan 1, 2012
62.997
+0.521
0.83%
jan 1, 2013
63.537
+0.54
0.86%
jan 1, 2014
64.061
+0.523
0.82%
jan 1, 2015
64.516
+0.455
0.71%
jan 1, 2016
64.88
+0.364
0.56%
Ranking of countries by current statistics by years


Comments: