29
/
en
AIzaSyAYiBZKx7MnpbEhh9jyipgxe19OcubqV5w
April 1, 2024
161860
Italy
ITA
true
2
1
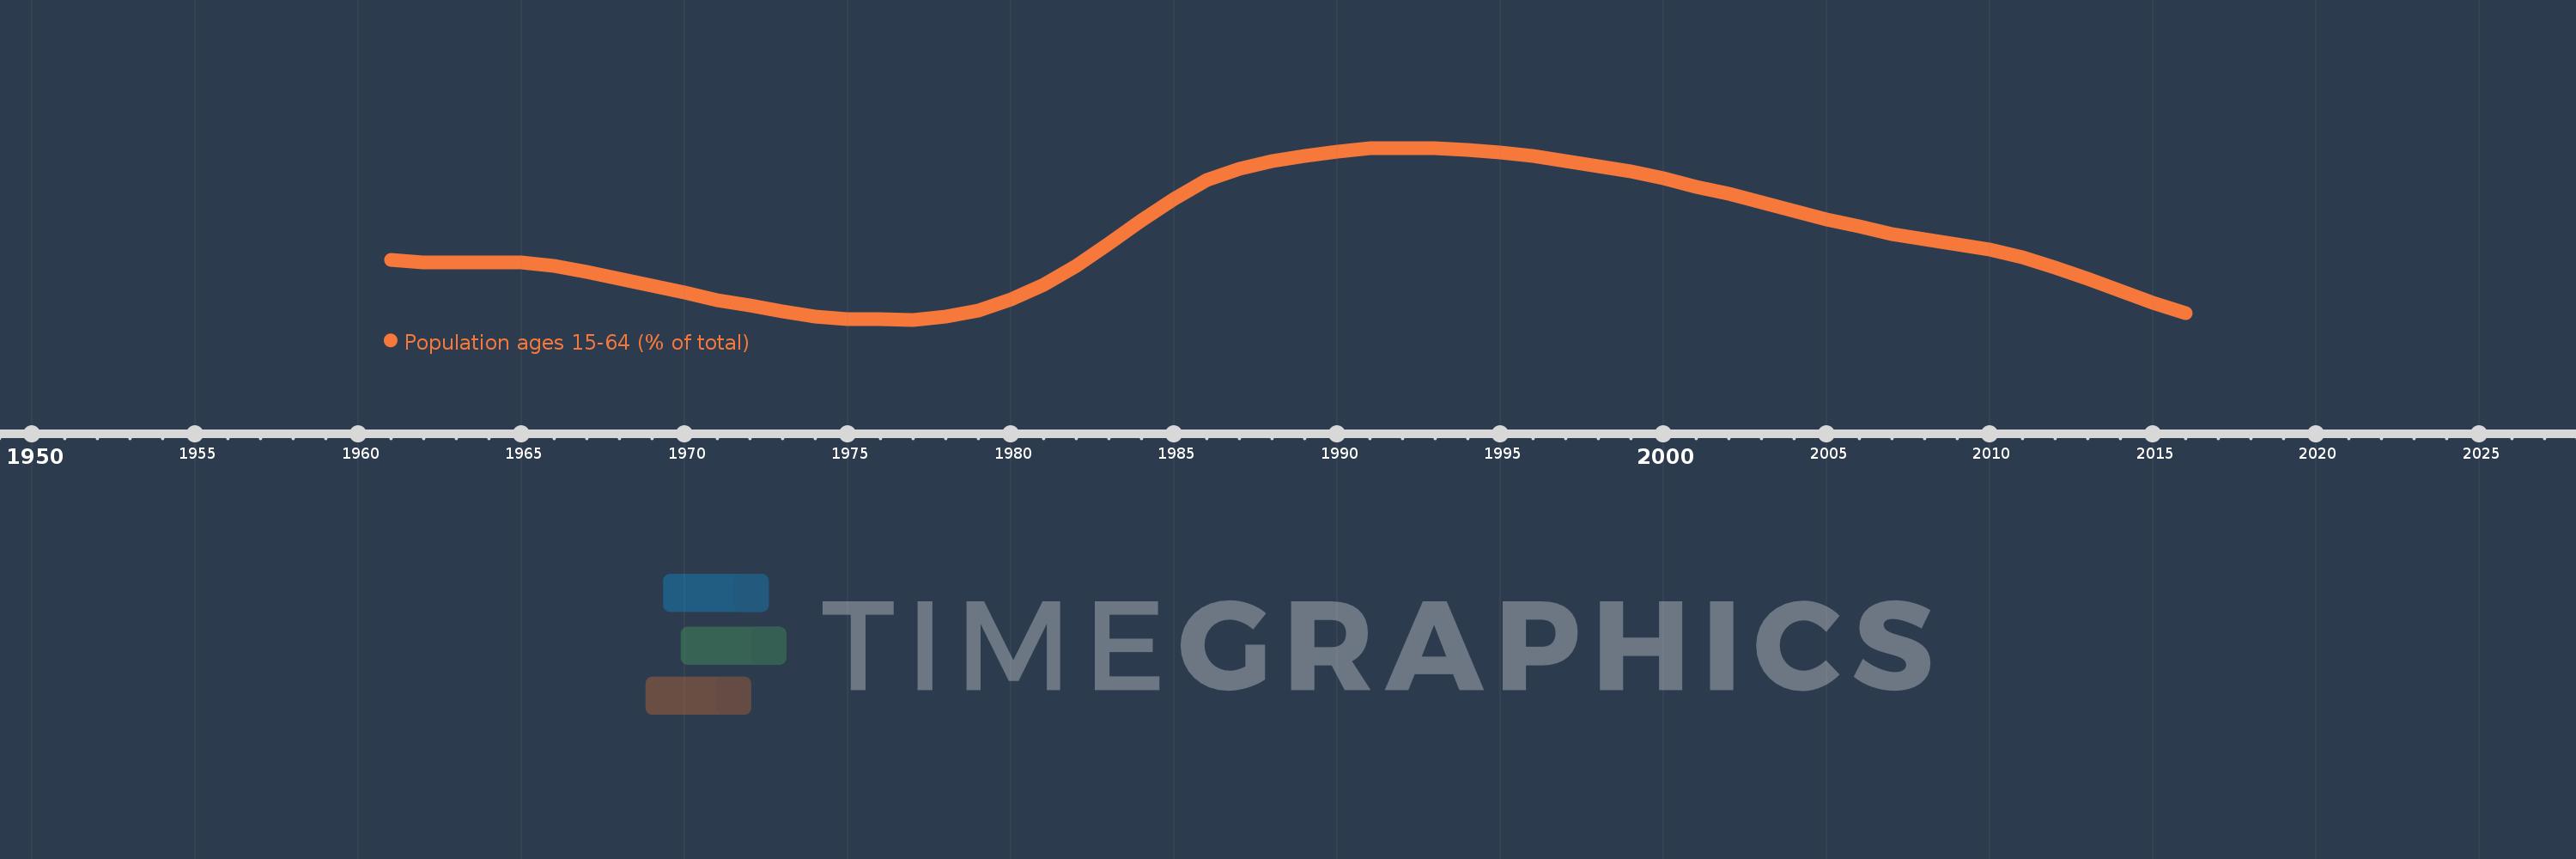
Population ages 15-64 (% of total)
2016,2015,2014,2013,2012,2011,2010,2009,2008,2007,2006,2005,2004,2003,2002,2001,2000,1999,1998,1997,1996,1995,1994,1993,1992,1991,1990,1989,1988,1987,1986,1985,1984,1983,1982,1981,1980,1979,1978,1977,1976,1975,1974,1973,1972,1971,1970,1969,1968,1967,1966,1965,1964,1963,1962,1961
This statistics in other country:
AfghanistanAlbaniaAlgeriaAngolaAntigua and BarbudaArab WorldArgentinaArmeniaArubaAustraliaAustriaAzerbaijanBahamas, TheBahrainBangladeshBarbadosBelarusBelgiumBelizeBeninBhutanBoliviaBosnia and HerzegovinaBotswanaBrazilBrunei DarussalamBulgariaBurkina FasoBurundiCabo VerdeCambodiaCameroonCanadaCaribbean small statesCentral African RepublicCentral Europe and the BalticsChadChannel IslandsChileChinaColombiaComorosCongo, Dem. Rep.Congo, Rep.Costa RicaCote d'IvoireCroatiaCubaCuracaoCyprusCzech RepublicDenmarkDjiboutiDominican RepublicEarly-demographic dividendEast Asia & PacificEast Asia & Pacific (excluding high income)East Asia & Pacific (IDA & IBRD countries)EcuadorEgypt, Arab Rep.El SalvadorEquatorial GuineaEritreaEstoniaEthiopiaEuro areaEurope & Central AsiaEurope & Central Asia (excluding high income)Europe & Central Asia (IDA & IBRD countries)European UnionFijiFinlandFragile and conflict affected situationsFranceFrench PolynesiaGabonGambia, TheGeorgiaGermanyGhanaGreeceGrenadaGuamGuatemalaGuineaGuinea-BissauGuyanaHaitiHeavily indebted poor countries (HIPC)High incomeHondurasHong Kong SAR, ChinaHungaryIBRD onlyIcelandIDA & IBRD totalIDA blendIDA onlyIDA totalIndiaIndonesiaIran, Islamic Rep.IraqIrelandIsraelItalyJamaicaJapanJordanKazakhstanKenyaKiribatiKorea, Dem. People’s Rep.Korea, Rep.KosovoKuwaitKyrgyz RepublicLao PDRLate-demographic dividendLatin America & Caribbean Latin America & Caribbean (excluding high income)Latin America & the Caribbean (IDA & IBRD countries)LatviaLeast developed countries: UN classificationLebanonLesothoLiberiaLibyaLithuaniaLow & middle incomeLow incomeLower middle incomeLuxembourgMacao SAR, ChinaMacedonia, FYRMadagascarMalawiMalaysiaMaldivesMaliMaltaMauritaniaMauritiusMexicoMicronesia, Fed. Sts.Middle East & North AfricaMiddle East & North Africa (excluding high income)Middle East & North Africa (IDA & IBRD countries)Middle incomeMoldovaMongoliaMontenegroMoroccoMozambiqueMyanmarNamibiaNepalNetherlandsNew CaledoniaNew ZealandNicaraguaNigerNigeriaNorth AmericaNorwayOECD membersOmanOther small statesPacific island small statesPakistanPanamaPapua New GuineaParaguayPeruPhilippinesPolandPortugalPost-demographic dividendPre-demographic dividendPuerto RicoQatarRomaniaRussian FederationRwandaSamoaSao Tome and PrincipeSaudi ArabiaSenegalSerbiaSeychellesSierra LeoneSingaporeSlovak RepublicSloveniaSmall statesSolomon IslandsSomaliaSouth AfricaSouth AsiaSouth Asia (IDA & IBRD)South SudanSpainSri LankaSt. LuciaSt. Vincent and the GrenadinesSub-Saharan Africa Sub-Saharan Africa (excluding high income)Sub-Saharan Africa (IDA & IBRD countries)SudanSurinameSwazilandSwedenSwitzerlandSyrian Arab RepublicTajikistanTanzaniaThailandTimor-LesteTogoTongaTrinidad and TobagoTunisiaTurkeyTurkmenistanUgandaUkraineUnited Arab EmiratesUnited KingdomUnited StatesUpper middle incomeUruguayUzbekistanVanuatuVenezuela, RBVietnamVirgin Islands (U.S.)West Bank and GazaWorldYemen, Rep.ZambiaZimbabwe Timeline:
This timeline shows a graph from 1961 to 2016 of Italy. No data until 1960. Number of actual observations by date: 56.
Source name:
World Development Indicators
Source organization:
World Bank staff estimates based on age distributions of United Nations Population Division's World Population Prospects.
Categories, topics:
Education, Health
Last updated:
apr 23, 2017
Indicators value changes by year
Minimum:
63.699
jan 1, 1977
Maximum:
68.724
jan 1, 1991
At the date of observation
Value
Absolute change
Change from previous value
jan 1, 1961
65.447
+65.447
0.0%
jan 1, 1962
65.371
-0.076
-0.12%
jan 1, 1963
65.363
-0.008
-0.01%
jan 1, 1964
65.384
+0.021
0.03%
jan 1, 1965
65.365
-0.019
-0.03%
jan 1, 1966
65.278
-0.087
-0.13%
jan 1, 1967
65.087
-0.191
-0.29%
jan 1, 1968
64.898
-0.189
-0.29%
jan 1, 1969
64.7
-0.198
-0.31%
jan 1, 1970
64.486
-0.214
-0.33%
jan 1, 1971
64.261
-0.225
-0.35%
jan 1, 1972
64.107
-0.154
-0.24%
jan 1, 1973
63.945
-0.162
-0.25%
jan 1, 1974
63.801
-0.144
-0.23%
jan 1, 1975
63.716
-0.085
-0.13%
jan 1, 1976
63.714
-0.002
0.0%
jan 1, 1977
63.699
-0.015
-0.02%
jan 1, 1978
63.782
+0.083
0.13%
jan 1, 1979
63.976
+0.195
0.31%
jan 1, 1980
64.293
+0.317
0.5%
jan 1, 1981
64.733
+0.439
0.68%
jan 1, 1982
65.274
+0.541
0.84%
jan 1, 1983
65.917
+0.643
0.98%
jan 1, 1984
66.6
+0.684
1.04%
jan 1, 1985
67.244
+0.643
0.97%
jan 1, 1986
67.792
+0.548
0.82%
jan 1, 1987
68.104
+0.312
0.46%
jan 1, 1988
68.331
+0.227
0.33%
jan 1, 1989
68.492
+0.161
0.24%
jan 1, 1990
68.617
+0.125
0.18%
jan 1, 1991
68.724
+0.107
0.16%
jan 1, 1992
68.724
0.0
0.0%
jan 1, 1993
68.704
-0.02
-0.03%
jan 1, 1994
68.66
-0.045
-0.06%
jan 1, 1995
68.59
-0.07
-0.1%
jan 1, 1996
68.495
-0.094
-0.14%
jan 1, 1997
68.351
-0.145
-0.21%
jan 1, 1998
68.2
-0.151
-0.22%
jan 1, 1999
68.033
-0.167
-0.25%
jan 1, 2000
67.831
-0.202
-0.3%
jan 1, 2001
67.585
-0.246
-0.36%
jan 1, 2002
67.388
-0.197
-0.29%
jan 1, 2003
67.141
-0.246
-0.37%
jan 1, 2004
66.872
-0.27
-0.4%
jan 1, 2005
66.623
-0.249
-0.37%
jan 1, 2006
66.422
-0.201
-0.3%
jan 1, 2007
66.211
-0.211
-0.32%
jan 1, 2008
66.046
-0.165
-0.25%
jan 1, 2009
65.905
-0.141
-0.21%
jan 1, 2010
65.746
-0.16
-0.24%
jan 1, 2011
65.537
-0.209
-0.32%
jan 1, 2012
65.227
-0.309
-0.47%
jan 1, 2013
64.896
-0.331
-0.51%
jan 1, 2014
64.547
-0.349
-0.54%
jan 1, 2015
64.2
-0.346
-0.54%
jan 1, 2016
63.88
-0.32
-0.5%
Ranking of countries by current statistics by years


Comments: