29
/
en
AIzaSyAYiBZKx7MnpbEhh9jyipgxe19OcubqV5w
April 1, 2024
132452
Fiji
FJI
true
2
1
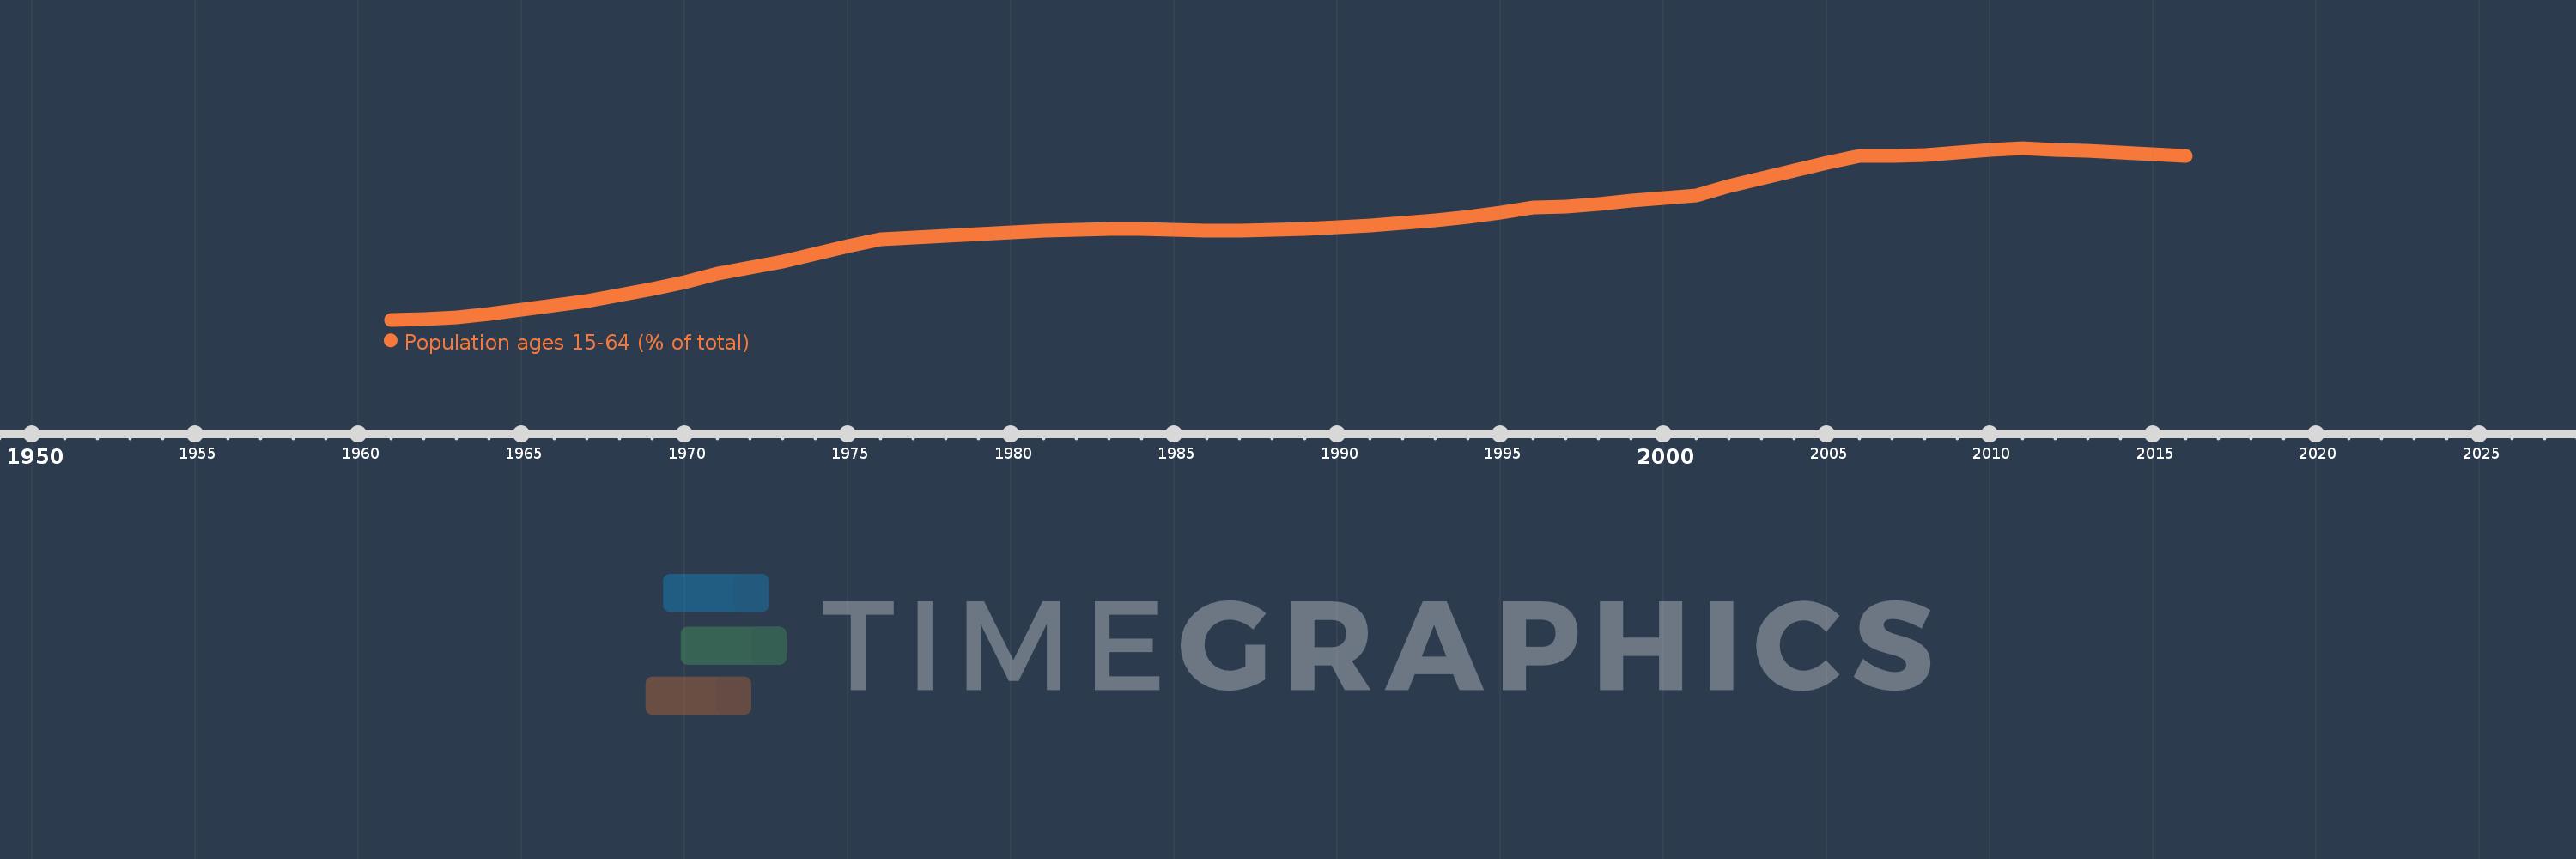
Population ages 15-64 (% of total)
2016,2015,2014,2013,2012,2011,2010,2009,2008,2007,2006,2005,2004,2003,2002,2001,2000,1999,1998,1997,1996,1995,1994,1993,1992,1991,1990,1989,1988,1987,1986,1985,1984,1983,1982,1981,1980,1979,1978,1977,1976,1975,1974,1973,1972,1971,1970,1969,1968,1967,1966,1965,1964,1963,1962,1961
This statistics in other country:
AfghanistanAlbaniaAlgeriaAngolaAntigua and BarbudaArab WorldArgentinaArmeniaArubaAustraliaAustriaAzerbaijanBahamas, TheBahrainBangladeshBarbadosBelarusBelgiumBelizeBeninBhutanBoliviaBosnia and HerzegovinaBotswanaBrazilBrunei DarussalamBulgariaBurkina FasoBurundiCabo VerdeCambodiaCameroonCanadaCaribbean small statesCentral African RepublicCentral Europe and the BalticsChadChannel IslandsChileChinaColombiaComorosCongo, Dem. Rep.Congo, Rep.Costa RicaCote d'IvoireCroatiaCubaCuracaoCyprusCzech RepublicDenmarkDjiboutiDominican RepublicEarly-demographic dividendEast Asia & PacificEast Asia & Pacific (excluding high income)East Asia & Pacific (IDA & IBRD countries)EcuadorEgypt, Arab Rep.El SalvadorEquatorial GuineaEritreaEstoniaEthiopiaEuro areaEurope & Central AsiaEurope & Central Asia (excluding high income)Europe & Central Asia (IDA & IBRD countries)European UnionFijiFinlandFragile and conflict affected situationsFranceFrench PolynesiaGabonGambia, TheGeorgiaGermanyGhanaGreeceGrenadaGuamGuatemalaGuineaGuinea-BissauGuyanaHaitiHeavily indebted poor countries (HIPC)High incomeHondurasHong Kong SAR, ChinaHungaryIBRD onlyIcelandIDA & IBRD totalIDA blendIDA onlyIDA totalIndiaIndonesiaIran, Islamic Rep.IraqIrelandIsraelItalyJamaicaJapanJordanKazakhstanKenyaKiribatiKorea, Dem. People’s Rep.Korea, Rep.KosovoKuwaitKyrgyz RepublicLao PDRLate-demographic dividendLatin America & Caribbean Latin America & Caribbean (excluding high income)Latin America & the Caribbean (IDA & IBRD countries)LatviaLeast developed countries: UN classificationLebanonLesothoLiberiaLibyaLithuaniaLow & middle incomeLow incomeLower middle incomeLuxembourgMacao SAR, ChinaMacedonia, FYRMadagascarMalawiMalaysiaMaldivesMaliMaltaMauritaniaMauritiusMexicoMicronesia, Fed. Sts.Middle East & North AfricaMiddle East & North Africa (excluding high income)Middle East & North Africa (IDA & IBRD countries)Middle incomeMoldovaMongoliaMontenegroMoroccoMozambiqueMyanmarNamibiaNepalNetherlandsNew CaledoniaNew ZealandNicaraguaNigerNigeriaNorth AmericaNorwayOECD membersOmanOther small statesPacific island small statesPakistanPanamaPapua New GuineaParaguayPeruPhilippinesPolandPortugalPost-demographic dividendPre-demographic dividendPuerto RicoQatarRomaniaRussian FederationRwandaSamoaSao Tome and PrincipeSaudi ArabiaSenegalSerbiaSeychellesSierra LeoneSingaporeSlovak RepublicSloveniaSmall statesSolomon IslandsSomaliaSouth AfricaSouth AsiaSouth Asia (IDA & IBRD)South SudanSpainSri LankaSt. LuciaSt. Vincent and the GrenadinesSub-Saharan Africa Sub-Saharan Africa (excluding high income)Sub-Saharan Africa (IDA & IBRD countries)SudanSurinameSwazilandSwedenSwitzerlandSyrian Arab RepublicTajikistanTanzaniaThailandTimor-LesteTogoTongaTrinidad and TobagoTunisiaTurkeyTurkmenistanUgandaUkraineUnited Arab EmiratesUnited KingdomUnited StatesUpper middle incomeUruguayUzbekistanVanuatuVenezuela, RBVietnamVirgin Islands (U.S.)West Bank and GazaWorldYemen, Rep.ZambiaZimbabwe Timeline:
This timeline shows a graph from 1961 to 2016 of Fiji. No data until 1960. Number of actual observations by date: 56.
Source name:
World Development Indicators
Source organization:
World Bank staff estimates based on age distributions of United Nations Population Division's World Population Prospects.
Categories, topics:
Education, Health
Last updated:
apr 23, 2017
Indicators value changes by year
Minimum:
49.536
jan 1, 1961
Maximum:
66.171
jan 1, 2011
At the date of observation
Value
Absolute change
Change from previous value
jan 1, 1961
49.536
+49.536
0.0%
jan 1, 1962
49.581
+0.045
0.09%
jan 1, 1963
49.78
+0.199
0.4%
jan 1, 1964
50.088
+0.309
0.62%
jan 1, 1965
50.472
+0.384
0.77%
jan 1, 1966
50.935
+0.463
0.92%
jan 1, 1967
51.382
+0.448
0.88%
jan 1, 1968
51.903
+0.521
1.01%
jan 1, 1969
52.504
+0.601
1.16%
jan 1, 1970
53.197
+0.693
1.32%
jan 1, 1971
53.977
+0.78
1.47%
jan 1, 1972
54.553
+0.576
1.07%
jan 1, 1973
55.206
+0.653
1.2%
jan 1, 1974
55.916
+0.71
1.29%
jan 1, 1975
56.647
+0.731
1.31%
jan 1, 1976
57.367
+0.72
1.27%
jan 1, 1977
57.511
+0.144
0.25%
jan 1, 1978
57.67
+0.159
0.28%
jan 1, 1979
57.845
+0.175
0.3%
jan 1, 1980
58.019
+0.174
0.3%
jan 1, 1981
58.174
+0.154
0.27%
jan 1, 1982
58.256
+0.082
0.14%
jan 1, 1983
58.319
+0.063
0.11%
jan 1, 1984
58.305
-0.014
-0.02%
jan 1, 1985
58.231
-0.074
-0.13%
jan 1, 1986
58.174
-0.056
-0.1%
jan 1, 1987
58.187
+0.013
0.02%
jan 1, 1988
58.242
+0.054
0.09%
jan 1, 1989
58.343
+0.101
0.17%
jan 1, 1990
58.479
+0.136
0.23%
jan 1, 1991
58.629
+0.15
0.26%
jan 1, 1992
58.899
+0.27
0.46%
jan 1, 1993
59.175
+0.276
0.47%
jan 1, 1994
59.5
+0.325
0.55%
jan 1, 1995
59.914
+0.414
0.7%
jan 1, 1996
60.411
+0.497
0.83%
jan 1, 1997
60.525
+0.114
0.19%
jan 1, 1998
60.76
+0.235
0.39%
jan 1, 1999
61.045
+0.285
0.47%
jan 1, 2000
61.306
+0.261
0.43%
jan 1, 2001
61.539
+0.233
0.38%
jan 1, 2002
62.472
+0.933
1.52%
jan 1, 2003
63.27
+0.798
1.28%
jan 1, 2004
63.992
+0.722
1.14%
jan 1, 2005
64.692
+0.7
1.09%
jan 1, 2006
65.357
+0.666
1.03%
jan 1, 2007
65.385
+0.028
0.04%
jan 1, 2008
65.509
+0.123
0.19%
jan 1, 2009
65.706
+0.198
0.3%
jan 1, 2010
65.939
+0.232
0.35%
jan 1, 2011
66.171
+0.232
0.35%
jan 1, 2012
66.001
-0.17
-0.26%
jan 1, 2013
65.855
-0.146
-0.22%
jan 1, 2014
65.713
-0.142
-0.22%
jan 1, 2015
65.566
-0.147
-0.22%
jan 1, 2016
65.424
-0.142
-0.22%
Ranking of countries by current statistics by years


Comments: