29
/
en
AIzaSyAYiBZKx7MnpbEhh9jyipgxe19OcubqV5w
April 1, 2024
26819
Early-demographic dividend
EAR
false
2
1
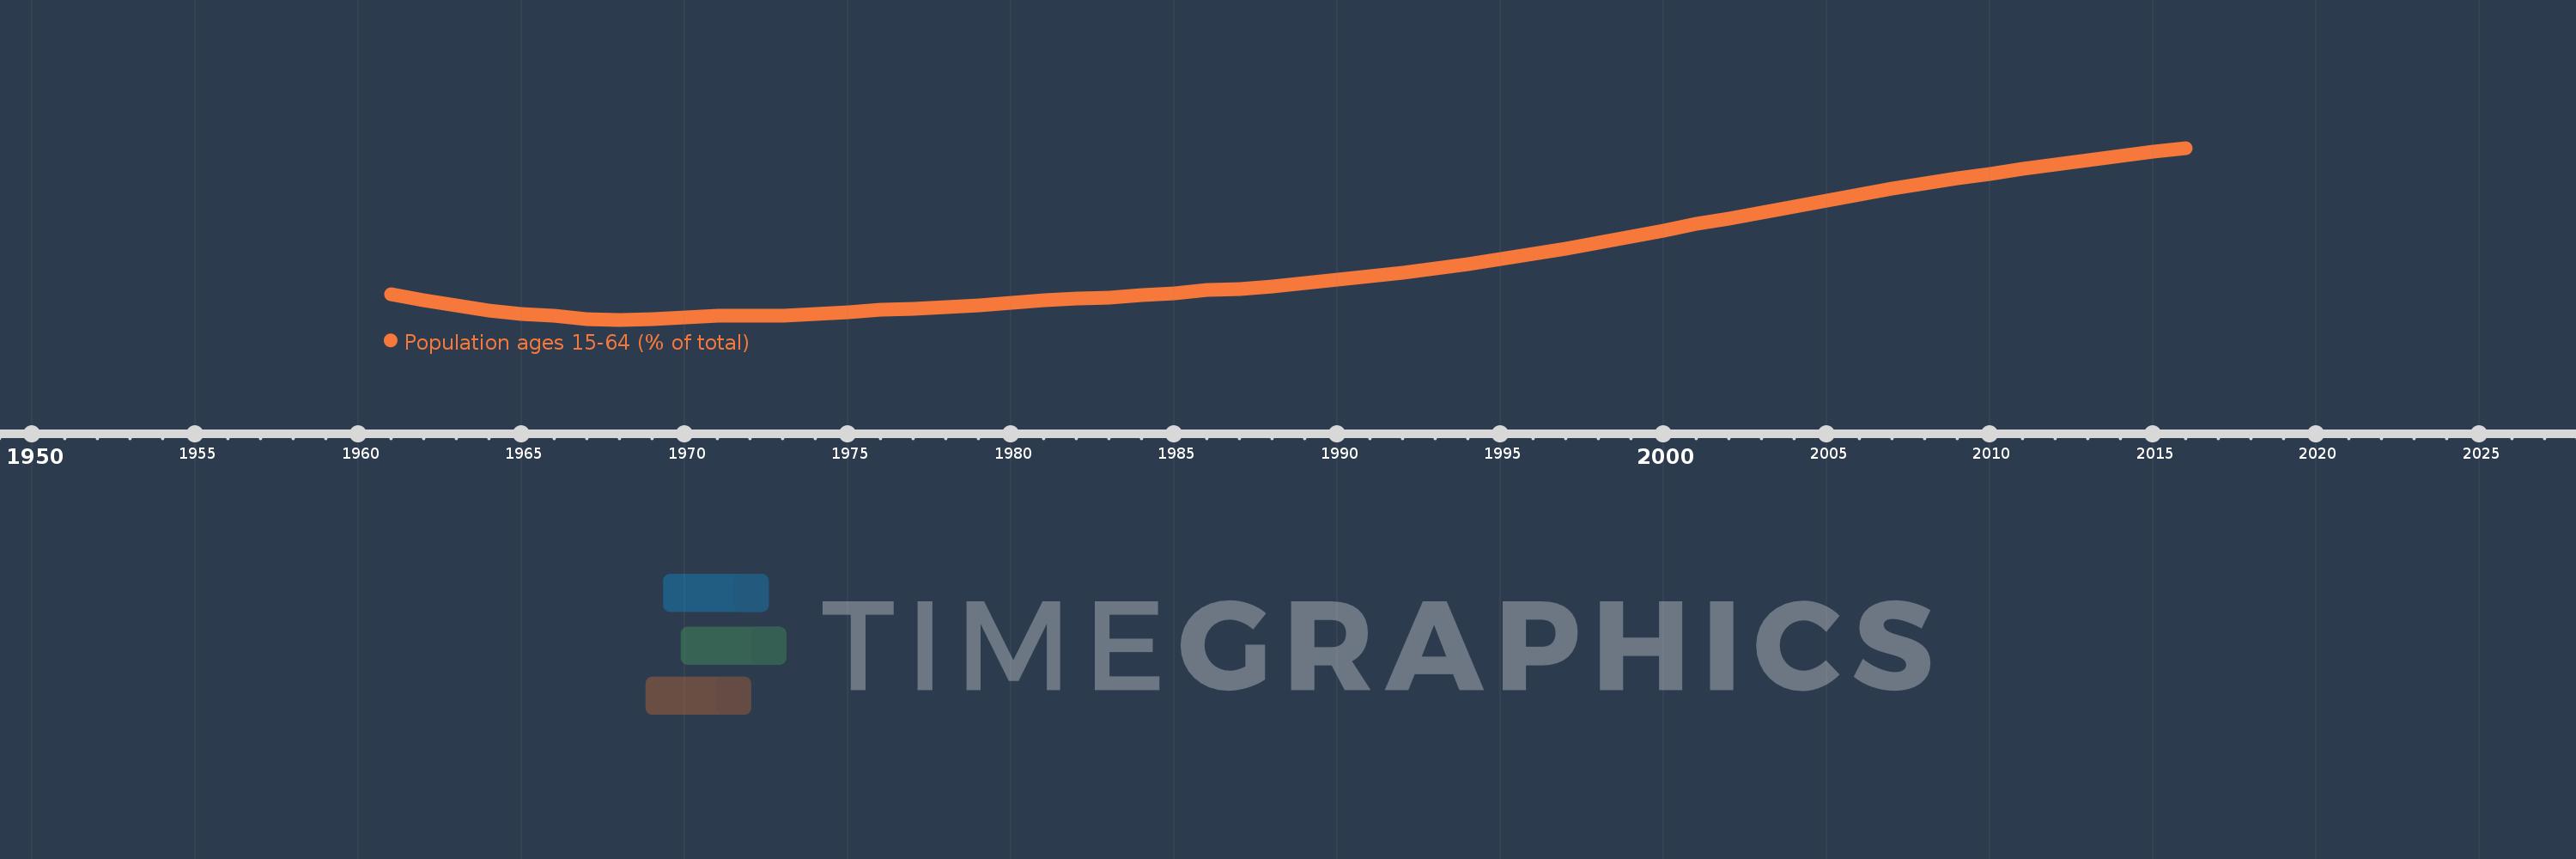
Population ages 15-64 (% of total)
2016,2015,2014,2013,2012,2011,2010,2009,2008,2007,2006,2005,2004,2003,2002,2001,2000,1999,1998,1997,1996,1995,1994,1993,1992,1991,1990,1989,1988,1987,1986,1985,1984,1983,1982,1981,1980,1979,1978,1977,1976,1975,1974,1973,1972,1971,1970,1969,1968,1967,1966,1965,1964,1963,1962,1961
This statistics in other country:
AfghanistanAlbaniaAlgeriaAngolaAntigua and BarbudaArab WorldArgentinaArmeniaArubaAustraliaAustriaAzerbaijanBahamas, TheBahrainBangladeshBarbadosBelarusBelgiumBelizeBeninBhutanBoliviaBosnia and HerzegovinaBotswanaBrazilBrunei DarussalamBulgariaBurkina FasoBurundiCabo VerdeCambodiaCameroonCanadaCaribbean small statesCentral African RepublicCentral Europe and the BalticsChadChannel IslandsChileChinaColombiaComorosCongo, Dem. Rep.Congo, Rep.Costa RicaCote d'IvoireCroatiaCubaCuracaoCyprusCzech RepublicDenmarkDjiboutiDominican RepublicEarly-demographic dividendEast Asia & PacificEast Asia & Pacific (excluding high income)East Asia & Pacific (IDA & IBRD countries)EcuadorEgypt, Arab Rep.El SalvadorEquatorial GuineaEritreaEstoniaEthiopiaEuro areaEurope & Central AsiaEurope & Central Asia (excluding high income)Europe & Central Asia (IDA & IBRD countries)European UnionFijiFinlandFragile and conflict affected situationsFranceFrench PolynesiaGabonGambia, TheGeorgiaGermanyGhanaGreeceGrenadaGuamGuatemalaGuineaGuinea-BissauGuyanaHaitiHeavily indebted poor countries (HIPC)High incomeHondurasHong Kong SAR, ChinaHungaryIBRD onlyIcelandIDA & IBRD totalIDA blendIDA onlyIDA totalIndiaIndonesiaIran, Islamic Rep.IraqIrelandIsraelItalyJamaicaJapanJordanKazakhstanKenyaKiribatiKorea, Dem. People’s Rep.Korea, Rep.KosovoKuwaitKyrgyz RepublicLao PDRLate-demographic dividendLatin America & Caribbean Latin America & Caribbean (excluding high income)Latin America & the Caribbean (IDA & IBRD countries)LatviaLeast developed countries: UN classificationLebanonLesothoLiberiaLibyaLithuaniaLow & middle incomeLow incomeLower middle incomeLuxembourgMacao SAR, ChinaMacedonia, FYRMadagascarMalawiMalaysiaMaldivesMaliMaltaMauritaniaMauritiusMexicoMicronesia, Fed. Sts.Middle East & North AfricaMiddle East & North Africa (excluding high income)Middle East & North Africa (IDA & IBRD countries)Middle incomeMoldovaMongoliaMontenegroMoroccoMozambiqueMyanmarNamibiaNepalNetherlandsNew CaledoniaNew ZealandNicaraguaNigerNigeriaNorth AmericaNorwayOECD membersOmanOther small statesPacific island small statesPakistanPanamaPapua New GuineaParaguayPeruPhilippinesPolandPortugalPost-demographic dividendPre-demographic dividendPuerto RicoQatarRomaniaRussian FederationRwandaSamoaSao Tome and PrincipeSaudi ArabiaSenegalSerbiaSeychellesSierra LeoneSingaporeSlovak RepublicSloveniaSmall statesSolomon IslandsSomaliaSouth AfricaSouth AsiaSouth Asia (IDA & IBRD)South SudanSpainSri LankaSt. LuciaSt. Vincent and the GrenadinesSub-Saharan Africa Sub-Saharan Africa (excluding high income)Sub-Saharan Africa (IDA & IBRD countries)SudanSurinameSwazilandSwedenSwitzerlandSyrian Arab RepublicTajikistanTanzaniaThailandTimor-LesteTogoTongaTrinidad and TobagoTunisiaTurkeyTurkmenistanUgandaUkraineUnited Arab EmiratesUnited KingdomUnited StatesUpper middle incomeUruguayUzbekistanVanuatuVenezuela, RBVietnamVirgin Islands (U.S.)West Bank and GazaWorldYemen, Rep.ZambiaZimbabwe Timeline:
This timeline shows a graph from 1961 to 2016 of Early-demographic dividend. No data until 1960. Number of actual observations by date: 56.
Source name:
World Development Indicators
Source organization:
World Bank staff estimates based on age distributions of United Nations Population Division's World Population Prospects.
Categories, topics:
Education, Health
Last updated:
apr 23, 2017
Indicators value changes by year
Minimum:
53.997
jan 1, 1968
Maximum:
64.641
jan 1, 2016
At the date of observation
Value
Absolute change
Change from previous value
jan 1, 1961
55.581
+55.581
0.0%
jan 1, 1962
55.23
-0.351
-0.63%
jan 1, 1963
54.88
-0.351
-0.63%
jan 1, 1964
54.565
-0.315
-0.57%
jan 1, 1965
54.344
-0.221
-0.41%
jan 1, 1966
54.239
-0.105
-0.19%
jan 1, 1967
54.053
-0.186
-0.34%
jan 1, 1968
53.997
-0.056
-0.1%
jan 1, 1969
54.037
+0.04
0.07%
jan 1, 1970
54.125
+0.088
0.16%
jan 1, 1971
54.236
+0.111
0.21%
jan 1, 1972
54.234
-0.002
0.0%
jan 1, 1973
54.273
+0.039
0.07%
jan 1, 1974
54.35
+0.076
0.14%
jan 1, 1975
54.465
+0.116
0.21%
jan 1, 1976
54.619
+0.153
0.28%
jan 1, 1977
54.658
+0.039
0.07%
jan 1, 1978
54.754
+0.097
0.18%
jan 1, 1979
54.891
+0.137
0.25%
jan 1, 1980
55.048
+0.156
0.28%
jan 1, 1981
55.211
+0.163
0.3%
jan 1, 1982
55.285
+0.074
0.13%
jan 1, 1983
55.382
+0.097
0.18%
jan 1, 1984
55.503
+0.121
0.22%
jan 1, 1985
55.655
+0.152
0.27%
jan 1, 1986
55.842
+0.187
0.34%
jan 1, 1987
55.921
+0.079
0.14%
jan 1, 1988
56.062
+0.141
0.25%
jan 1, 1989
56.25
+0.189
0.34%
jan 1, 1990
56.474
+0.223
0.4%
jan 1, 1991
56.721
+0.248
0.44%
jan 1, 1992
56.915
+0.194
0.34%
jan 1, 1993
57.15
+0.235
0.41%
jan 1, 1994
57.425
+0.275
0.48%
jan 1, 1995
57.741
+0.315
0.55%
jan 1, 1996
58.092
+0.351
0.61%
jan 1, 1997
58.409
+0.317
0.55%
jan 1, 1998
58.753
+0.344
0.59%
jan 1, 1999
59.123
+0.37
0.63%
jan 1, 2000
59.516
+0.393
0.66%
jan 1, 2001
59.927
+0.411
0.69%
jan 1, 2002
60.261
+0.334
0.56%
jan 1, 2003
60.624
+0.363
0.6%
jan 1, 2004
61.005
+0.381
0.63%
jan 1, 2005
61.388
+0.383
0.63%
jan 1, 2006
61.764
+0.376
0.61%
jan 1, 2007
62.102
+0.338
0.55%
jan 1, 2008
62.427
+0.325
0.52%
jan 1, 2009
62.741
+0.314
0.5%
jan 1, 2010
63.051
+0.31
0.49%
jan 1, 2011
63.358
+0.307
0.49%
jan 1, 2012
63.624
+0.267
0.42%
jan 1, 2013
63.892
+0.268
0.42%
jan 1, 2014
64.156
+0.264
0.41%
jan 1, 2015
64.407
+0.251
0.39%
jan 1, 2016
64.641
+0.234
0.36%
Ranking of countries by current statistics by years


Comments: