29
/
en
AIzaSyAYiBZKx7MnpbEhh9jyipgxe19OcubqV5w
April 1, 2024
50369
Middle East & North Africa (IDA & IBRD countries)
TMN
false
2
1
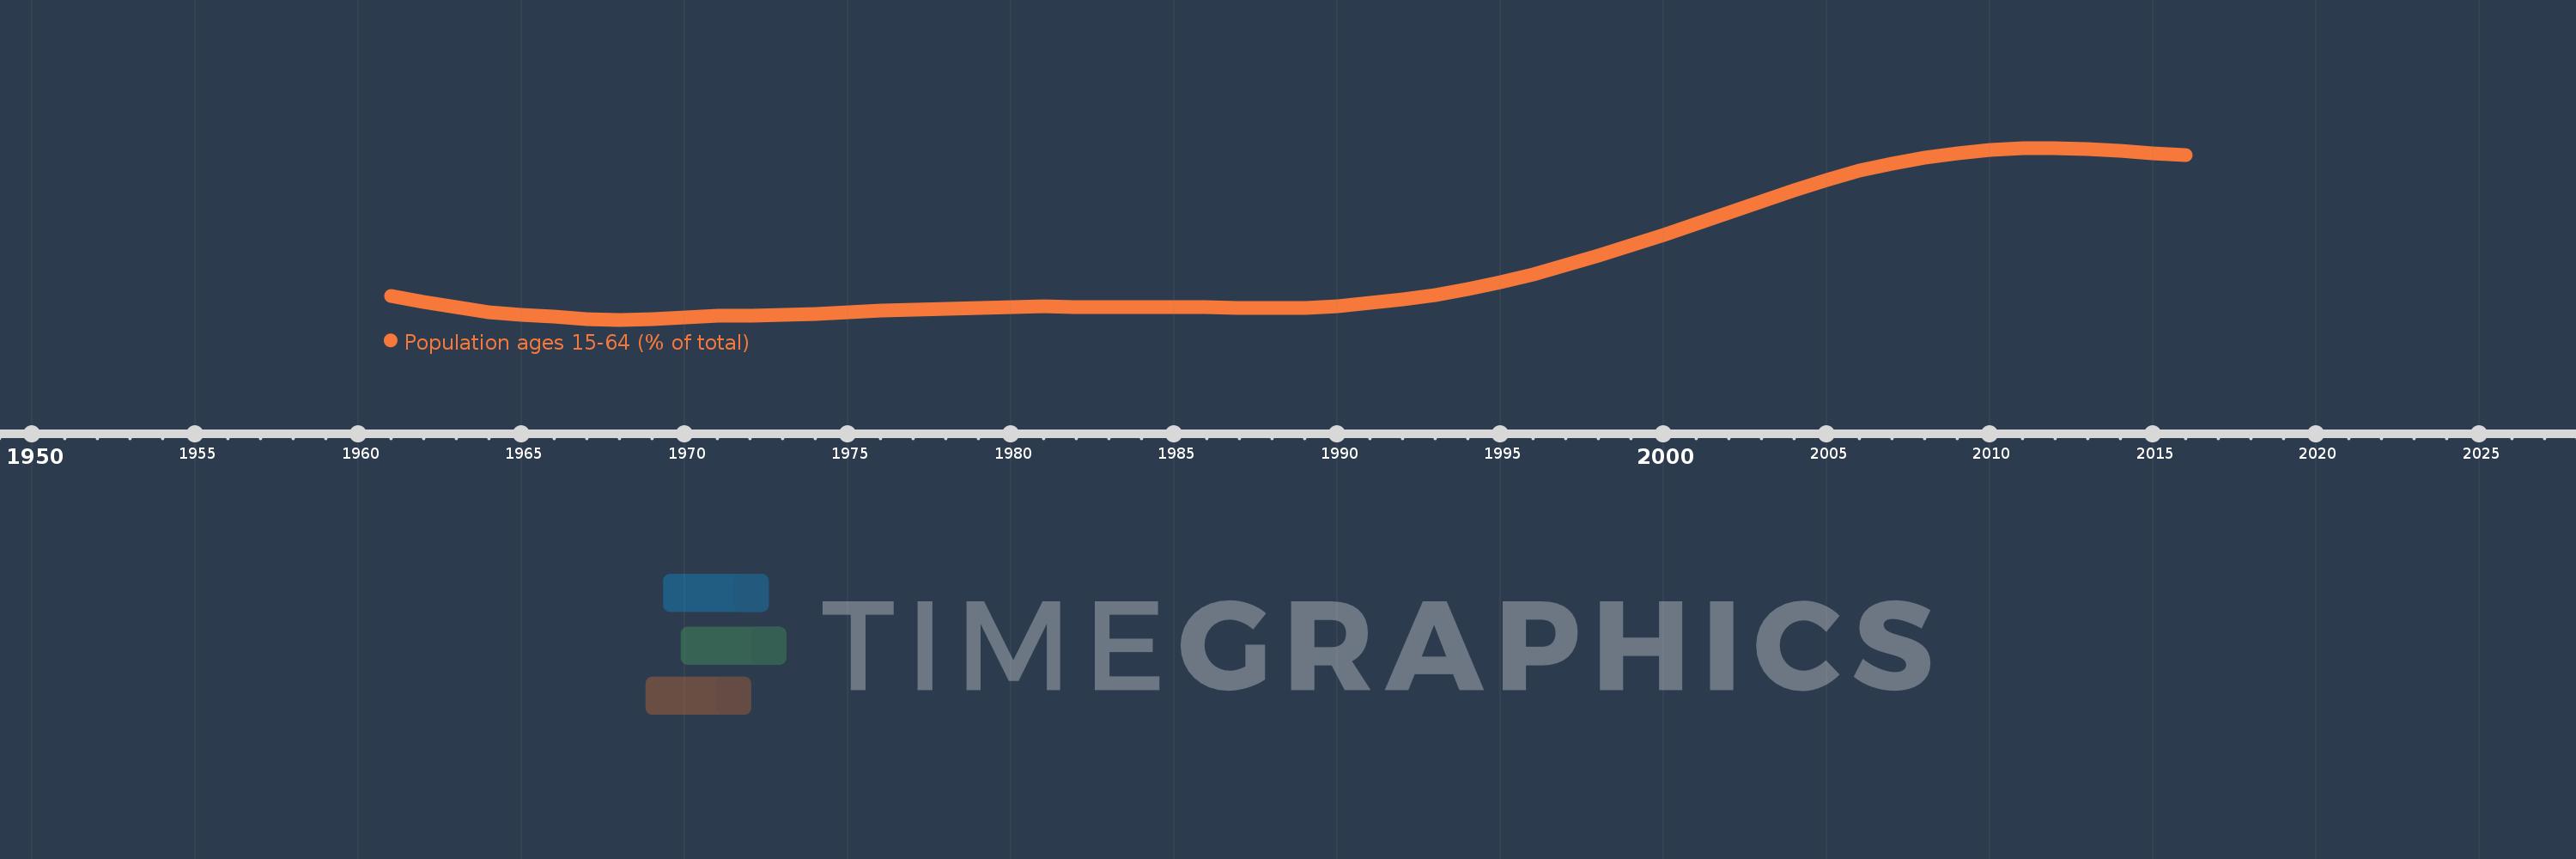
Population ages 15-64 (% of total)
2016,2015,2014,2013,2012,2011,2010,2009,2008,2007,2006,2005,2004,2003,2002,2001,2000,1999,1998,1997,1996,1995,1994,1993,1992,1991,1990,1989,1988,1987,1986,1985,1984,1983,1982,1981,1980,1979,1978,1977,1976,1975,1974,1973,1972,1971,1970,1969,1968,1967,1966,1965,1964,1963,1962,1961
This statistics in other country:
AfghanistanAlbaniaAlgeriaAngolaAntigua and BarbudaArab WorldArgentinaArmeniaArubaAustraliaAustriaAzerbaijanBahamas, TheBahrainBangladeshBarbadosBelarusBelgiumBelizeBeninBhutanBoliviaBosnia and HerzegovinaBotswanaBrazilBrunei DarussalamBulgariaBurkina FasoBurundiCabo VerdeCambodiaCameroonCanadaCaribbean small statesCentral African RepublicCentral Europe and the BalticsChadChannel IslandsChileChinaColombiaComorosCongo, Dem. Rep.Congo, Rep.Costa RicaCote d'IvoireCroatiaCubaCuracaoCyprusCzech RepublicDenmarkDjiboutiDominican RepublicEarly-demographic dividendEast Asia & PacificEast Asia & Pacific (excluding high income)East Asia & Pacific (IDA & IBRD countries)EcuadorEgypt, Arab Rep.El SalvadorEquatorial GuineaEritreaEstoniaEthiopiaEuro areaEurope & Central AsiaEurope & Central Asia (excluding high income)Europe & Central Asia (IDA & IBRD countries)European UnionFijiFinlandFragile and conflict affected situationsFranceFrench PolynesiaGabonGambia, TheGeorgiaGermanyGhanaGreeceGrenadaGuamGuatemalaGuineaGuinea-BissauGuyanaHaitiHeavily indebted poor countries (HIPC)High incomeHondurasHong Kong SAR, ChinaHungaryIBRD onlyIcelandIDA & IBRD totalIDA blendIDA onlyIDA totalIndiaIndonesiaIran, Islamic Rep.IraqIrelandIsraelItalyJamaicaJapanJordanKazakhstanKenyaKiribatiKorea, Dem. People’s Rep.Korea, Rep.KosovoKuwaitKyrgyz RepublicLao PDRLate-demographic dividendLatin America & Caribbean Latin America & Caribbean (excluding high income)Latin America & the Caribbean (IDA & IBRD countries)LatviaLeast developed countries: UN classificationLebanonLesothoLiberiaLibyaLithuaniaLow & middle incomeLow incomeLower middle incomeLuxembourgMacao SAR, ChinaMacedonia, FYRMadagascarMalawiMalaysiaMaldivesMaliMaltaMauritaniaMauritiusMexicoMicronesia, Fed. Sts.Middle East & North AfricaMiddle East & North Africa (excluding high income)Middle East & North Africa (IDA & IBRD countries)Middle incomeMoldovaMongoliaMontenegroMoroccoMozambiqueMyanmarNamibiaNepalNetherlandsNew CaledoniaNew ZealandNicaraguaNigerNigeriaNorth AmericaNorwayOECD membersOmanOther small statesPacific island small statesPakistanPanamaPapua New GuineaParaguayPeruPhilippinesPolandPortugalPost-demographic dividendPre-demographic dividendPuerto RicoQatarRomaniaRussian FederationRwandaSamoaSao Tome and PrincipeSaudi ArabiaSenegalSerbiaSeychellesSierra LeoneSingaporeSlovak RepublicSloveniaSmall statesSolomon IslandsSomaliaSouth AfricaSouth AsiaSouth Asia (IDA & IBRD)South SudanSpainSri LankaSt. LuciaSt. Vincent and the GrenadinesSub-Saharan Africa Sub-Saharan Africa (excluding high income)Sub-Saharan Africa (IDA & IBRD countries)SudanSurinameSwazilandSwedenSwitzerlandSyrian Arab RepublicTajikistanTanzaniaThailandTimor-LesteTogoTongaTrinidad and TobagoTunisiaTurkeyTurkmenistanUgandaUkraineUnited Arab EmiratesUnited KingdomUnited StatesUpper middle incomeUruguayUzbekistanVanuatuVenezuela, RBVietnamVirgin Islands (U.S.)West Bank and GazaWorldYemen, Rep.ZambiaZimbabwe Timeline:
This timeline shows a graph from 1961 to 2016 of Middle East & North Africa (IDA & IBRD countries). No data until 1960. Number of actual observations by date: 56.
Source name:
World Development Indicators
Source organization:
World Bank staff estimates based on age distributions of United Nations Population Division's World Population Prospects.
Categories, topics:
Education, Health
Last updated:
apr 23, 2017
Indicators value changes by year
Minimum:
51.548
jan 1, 1968
Maximum:
64.531
jan 1, 2011
At the date of observation
Value
Absolute change
Change from previous value
jan 1, 1961
53.324
+53.324
0.0%
jan 1, 1962
52.883
-0.441
-0.83%
jan 1, 1963
52.476
-0.407
-0.77%
jan 1, 1964
52.134
-0.342
-0.65%
jan 1, 1965
51.904
-0.23
-0.44%
jan 1, 1966
51.803
-0.101
-0.19%
jan 1, 1967
51.597
-0.206
-0.4%
jan 1, 1968
51.548
-0.05
-0.1%
jan 1, 1969
51.607
+0.059
0.12%
jan 1, 1970
51.719
+0.112
0.22%
jan 1, 1971
51.858
+0.139
0.27%
jan 1, 1972
51.852
-0.006
-0.01%
jan 1, 1973
51.903
+0.051
0.1%
jan 1, 1974
51.996
+0.093
0.18%
jan 1, 1975
52.115
+0.119
0.23%
jan 1, 1976
52.248
+0.133
0.25%
jan 1, 1977
52.306
+0.058
0.11%
jan 1, 1978
52.366
+0.06
0.11%
jan 1, 1979
52.432
+0.066
0.13%
jan 1, 1980
52.507
+0.075
0.14%
jan 1, 1981
52.586
+0.079
0.15%
jan 1, 1982
52.531
-0.055
-0.1%
jan 1, 1983
52.509
-0.021
-0.04%
jan 1, 1984
52.508
-0.002
0.0%
jan 1, 1985
52.514
+0.006
0.01%
jan 1, 1986
52.531
+0.017
0.03%
jan 1, 1987
52.454
-0.077
-0.15%
jan 1, 1988
52.429
-0.025
-0.05%
jan 1, 1989
52.468
+0.04
0.08%
jan 1, 1990
52.592
+0.124
0.24%
jan 1, 1991
52.818
+0.227
0.43%
jan 1, 1992
53.081
+0.263
0.5%
jan 1, 1993
53.437
+0.356
0.67%
jan 1, 1994
53.879
+0.442
0.83%
jan 1, 1995
54.398
+0.519
0.96%
jan 1, 1996
54.978
+0.58
1.07%
jan 1, 1997
55.671
+0.693
1.26%
jan 1, 1998
56.398
+0.727
1.31%
jan 1, 1999
57.158
+0.76
1.35%
jan 1, 2000
57.956
+0.798
1.4%
jan 1, 2001
58.787
+0.831
1.43%
jan 1, 2002
59.613
+0.826
1.41%
jan 1, 2003
60.461
+0.848
1.42%
jan 1, 2004
61.312
+0.85
1.41%
jan 1, 2005
62.123
+0.811
1.32%
jan 1, 2006
62.854
+0.731
1.18%
jan 1, 2007
63.359
+0.505
0.8%
jan 1, 2008
63.79
+0.431
0.68%
jan 1, 2009
64.131
+0.341
0.53%
jan 1, 2010
64.377
+0.246
0.38%
jan 1, 2011
64.531
+0.154
0.24%
jan 1, 2012
64.522
-0.009
-0.01%
jan 1, 2013
64.438
-0.084
-0.13%
jan 1, 2014
64.3
-0.138
-0.21%
jan 1, 2015
64.143
-0.157
-0.24%
jan 1, 2016
63.992
-0.151
-0.23%
Ranking of countries by current statistics by years


Comments: