29
/
en
AIzaSyAYiBZKx7MnpbEhh9jyipgxe19OcubqV5w
April 1, 2024
90712
Brazil
BRA
true
2
1
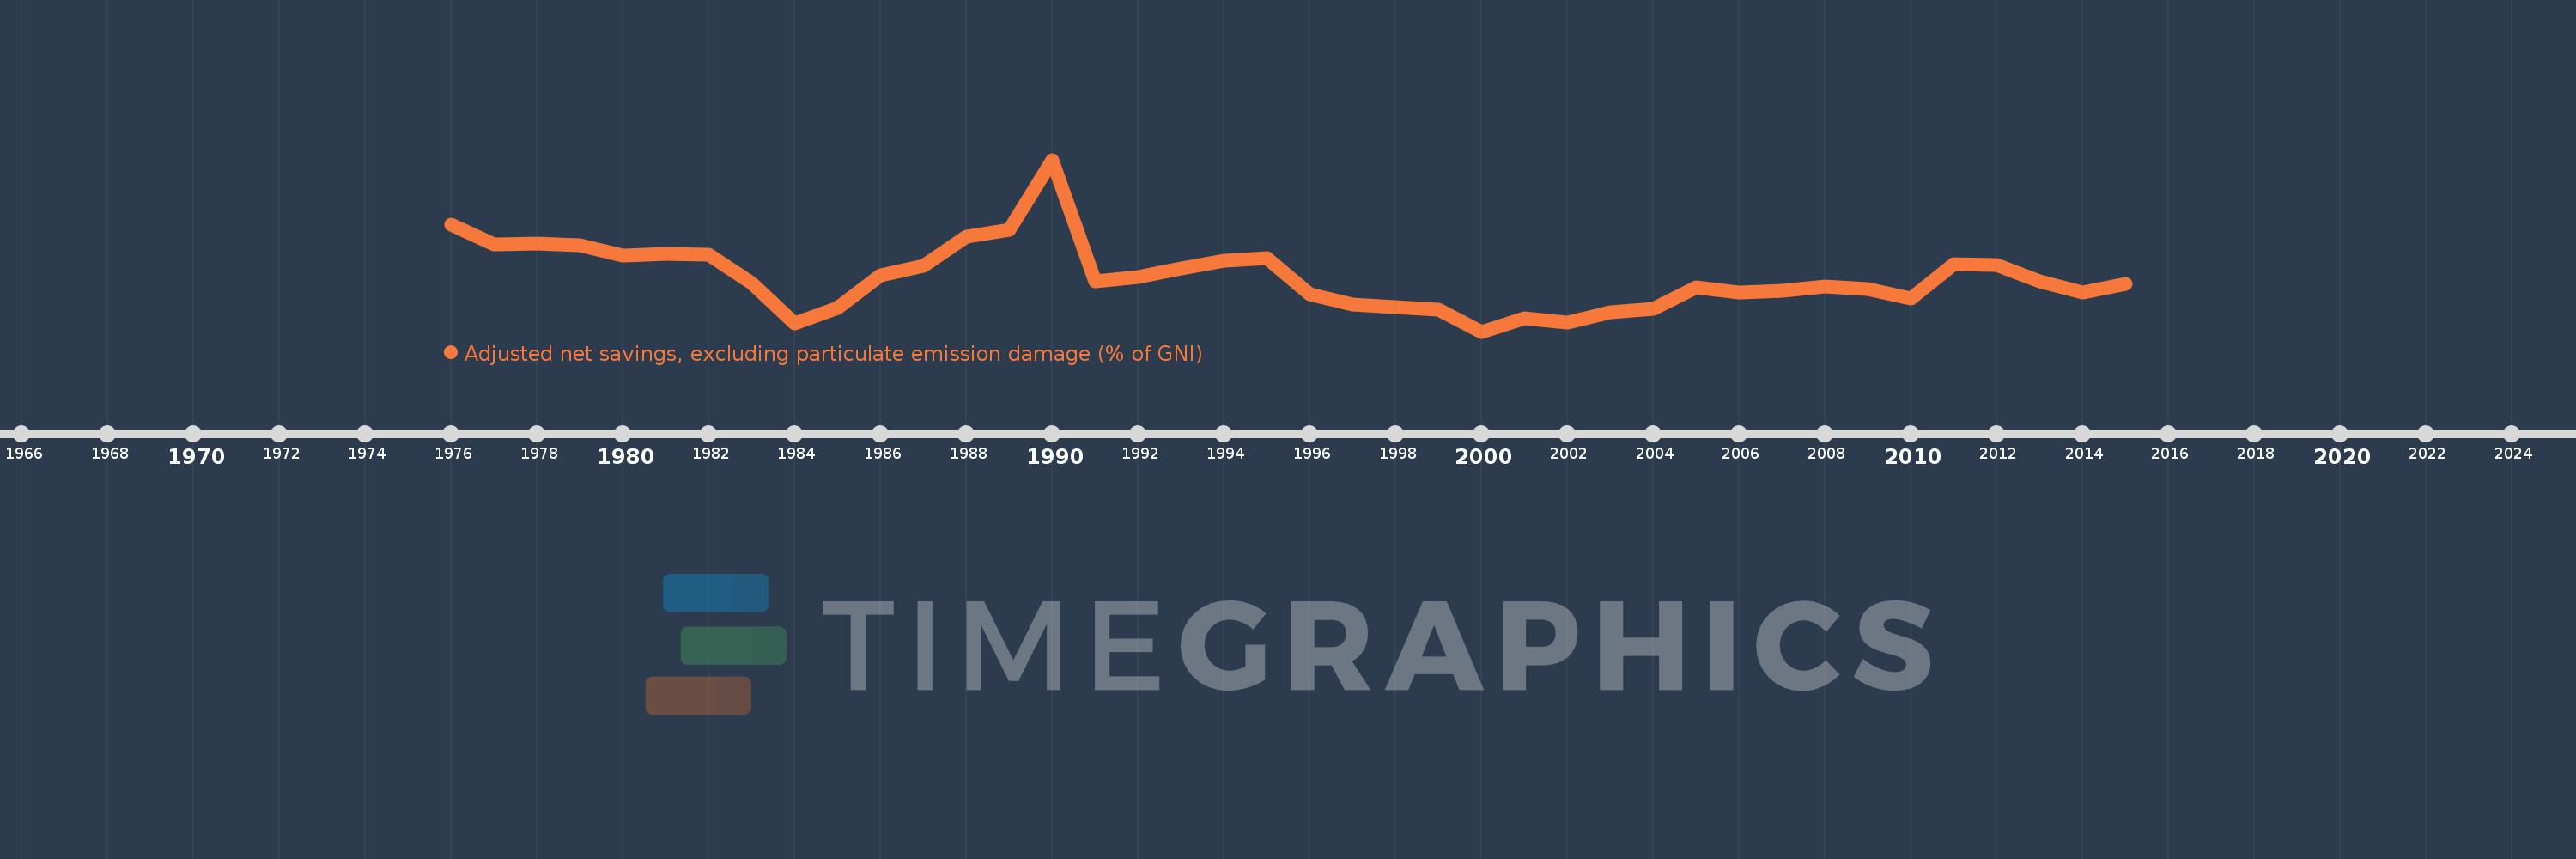
Adjusted net savings, excluding particulate emission damage (% of GNI)
2015,2014,2013,2012,2011,2010,2009,2008,2007,2006,2005,2004,2003,2002,2001,2000,1999,1998,1997,1996,1995,1994,1993,1992,1991,1990,1989,1988,1987,1986,1985,1984,1983,1982,1981,1980,1979,1978,1977,1976
This statistics in other country:
AfghanistanAlbaniaAlgeriaAngolaArab WorldArgentinaArmeniaAustraliaAustriaAzerbaijanBahamas, TheBahrainBangladeshBarbadosBelarusBelgiumBelizeBeninBhutanBoliviaBotswanaBrazilBrunei DarussalamBulgariaBurkina FasoBurundiCabo VerdeCambodiaCameroonCanadaCaribbean small statesCentral African RepublicCentral Europe and the BalticsChadChileChinaColombiaComorosCongo, Dem. Rep.Congo, Rep.Costa RicaCote d'IvoireCroatiaCyprusCzech RepublicDenmarkDjiboutiDominicaDominican RepublicEarly-demographic dividendEast Asia & PacificEast Asia & Pacific (excluding high income)East Asia & Pacific (IDA & IBRD countries)EcuadorEgypt, Arab Rep.El SalvadorEquatorial GuineaEritreaEstoniaEthiopiaEuro areaEurope & Central AsiaEurope & Central Asia (excluding high income)Europe & Central Asia (IDA & IBRD countries)European UnionFijiFinlandFragile and conflict affected situationsFranceGabonGambia, TheGeorgiaGermanyGhanaGreeceGuatemalaGuineaGuinea-BissauGuyanaHaitiHeavily indebted poor countries (HIPC)High incomeHondurasHungaryIBRD onlyIcelandIDA & IBRD totalIDA blendIDA onlyIDA totalIndiaIndonesiaIran, Islamic Rep.IraqIrelandIsraelItalyJamaicaJapanJordanKazakhstanKenyaKiribatiKorea, Rep.KuwaitKyrgyz RepublicLao PDRLate-demographic dividendLatin America & Caribbean Latin America & Caribbean (excluding high income)Latin America & the Caribbean (IDA & IBRD countries)LatviaLeast developed countries: UN classificationLebanonLesothoLiberiaLibyaLithuaniaLow & middle incomeLow incomeLower middle incomeLuxembourgMacedonia, FYRMadagascarMalawiMalaysiaMaldivesMaliMauritaniaMauritiusMexicoMiddle East & North AfricaMiddle East & North Africa (excluding high income)Middle East & North Africa (IDA & IBRD countries)Middle incomeMoldovaMongoliaMoroccoMozambiqueNamibiaNepalNetherlandsNew ZealandNicaraguaNigerNigeriaNorth AmericaNorwayOECD membersOmanOther small statesPacific island small statesPakistanPanamaPapua New GuineaParaguayPeruPhilippinesPolandPortugalPost-demographic dividendPre-demographic dividendQatarRomaniaRussian FederationRwandaSaudi ArabiaSenegalSeychellesSierra LeoneSingaporeSlovak RepublicSloveniaSmall statesSolomon IslandsSouth AfricaSouth AsiaSouth Asia (IDA & IBRD)SpainSri LankaSt. LuciaSt. Vincent and the GrenadinesSub-Saharan Africa Sub-Saharan Africa (excluding high income)Sub-Saharan Africa (IDA & IBRD countries)SudanSurinameSwazilandSwedenSwitzerlandSyrian Arab RepublicTajikistanTanzaniaThailandTogoTongaTrinidad and TobagoTunisiaTurkeyUgandaUkraineUnited KingdomUnited StatesUpper middle incomeUruguayVanuatuVenezuela, RBVietnamWorldYemen, Rep.ZambiaZimbabwe Timeline:
This timeline shows a graph from 1976 to 2015 of Brazil. No data until 1975. Number of actual observations by date: 40.
Source name:
World Development Indicators
Source organization:
World Bank staff estimates based on sources and methods in World Bank's "The Changing Wealth of Nations: Measuring Sustainable Development in the New Millennium" (2011).
Categories, topics:
Economy & Growth, Environment
Last updated:
apr 23, 2017
Indicators value changes by year
Maximum:
27.126
jan 1, 1990
At the date of observation
Value
Absolute change
Change from previous value
jan 1, 1976
16.882
+16.882
0.0%
jan 1, 1977
13.768
-3.114
-18.45%
jan 1, 1978
13.964
+0.197
1.43%
jan 1, 1979
13.722
-0.242
-1.74%
jan 1, 1980
12.017
-1.705
-12.42%
jan 1, 1981
12.291
+0.274
2.28%
jan 1, 1982
12.216
-0.075
-0.61%
jan 1, 1983
7.729
-4.487
-36.73%
jan 1, 1984
1.382
-6.347
-82.12%
jan 1, 1985
3.742
+2.36
170.71%
jan 1, 1986
8.959
+5.217
139.42%
jan 1, 1987
10.417
+1.458
16.27%
jan 1, 1988
14.968
+4.551
43.69%
jan 1, 1989
16.066
+1.098
7.33%
jan 1, 1990
27.126
+11.06
68.84%
jan 1, 1991
7.989
-19.137
-70.55%
jan 1, 1992
8.722
+0.733
9.17%
jan 1, 1993
10.07
+1.348
15.46%
jan 1, 1994
11.232
+1.162
11.54%
jan 1, 1995
11.658
+0.426
3.79%
jan 1, 1996
5.93
-5.728
-49.13%
jan 1, 1997
4.309
-1.621
-27.33%
jan 1, 1998
3.966
-0.343
-7.96%
jan 1, 1999
3.511
-0.455
-11.48%
jan 1, 2000
0.076
-3.435
-97.84%
jan 1, 2001
2.176
+2.1
2.76K%
jan 1, 2002
1.559
-0.617
-28.34%
jan 1, 2003
3.06
+1.5
96.23%
jan 1, 2004
3.61
+0.55
17.99%
jan 1, 2005
7.048
+3.438
95.24%
jan 1, 2006
6.176
-0.872
-12.37%
jan 1, 2007
6.515
+0.339
5.48%
jan 1, 2008
7.17
+0.656
10.06%
jan 1, 2009
6.816
-0.355
-4.95%
jan 1, 2010
5.224
-1.592
-23.36%
jan 1, 2011
10.675
+5.451
104.36%
jan 1, 2012
10.554
-0.121
-1.13%
jan 1, 2013
8.037
-2.516
-23.84%
jan 1, 2014
6.225
-1.812
-22.55%
jan 1, 2015
7.566
+1.341
21.54%
Ranking of countries by current statistics by years


Comments: