29
/
en
AIzaSyAYiBZKx7MnpbEhh9jyipgxe19OcubqV5w
April 1, 2024
276330
United States
USA
true
2
1
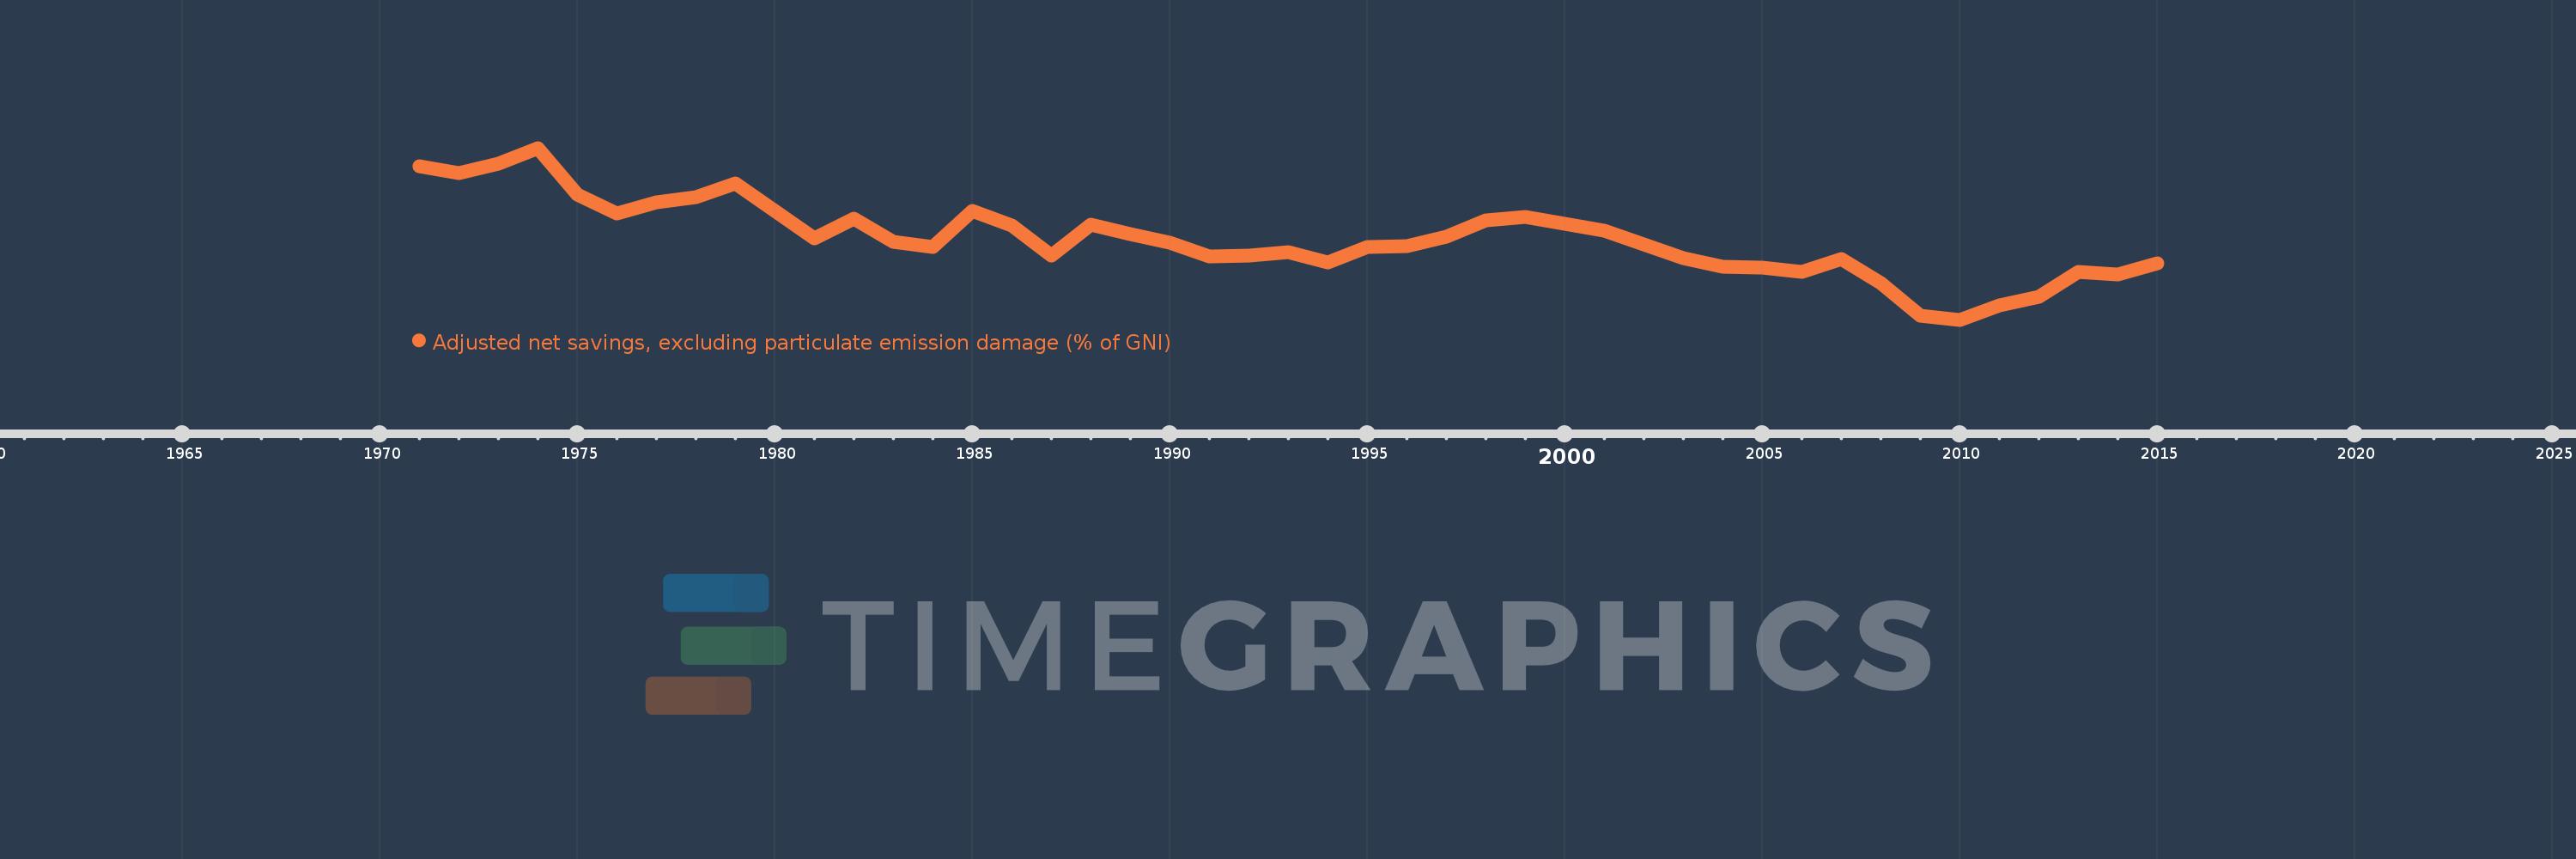
Adjusted net savings, excluding particulate emission damage (% of GNI)
2015,2014,2013,2012,2011,2010,2009,2008,2007,2006,2005,2004,2003,2002,2001,2000,1999,1998,1997,1996,1995,1994,1993,1992,1991,1990,1989,1988,1987,1986,1985,1984,1983,1982,1981,1980,1979,1978,1977,1976,1975,1974,1973,1972,1971
This statistics in other country:
AfghanistanAlbaniaAlgeriaAngolaArab WorldArgentinaArmeniaAustraliaAustriaAzerbaijanBahamas, TheBahrainBangladeshBarbadosBelarusBelgiumBelizeBeninBhutanBoliviaBotswanaBrazilBrunei DarussalamBulgariaBurkina FasoBurundiCabo VerdeCambodiaCameroonCanadaCaribbean small statesCentral African RepublicCentral Europe and the BalticsChadChileChinaColombiaComorosCongo, Dem. Rep.Congo, Rep.Costa RicaCote d'IvoireCroatiaCyprusCzech RepublicDenmarkDjiboutiDominicaDominican RepublicEarly-demographic dividendEast Asia & PacificEast Asia & Pacific (excluding high income)East Asia & Pacific (IDA & IBRD countries)EcuadorEgypt, Arab Rep.El SalvadorEquatorial GuineaEritreaEstoniaEthiopiaEuro areaEurope & Central AsiaEurope & Central Asia (excluding high income)Europe & Central Asia (IDA & IBRD countries)European UnionFijiFinlandFragile and conflict affected situationsFranceGabonGambia, TheGeorgiaGermanyGhanaGreeceGuatemalaGuineaGuinea-BissauGuyanaHaitiHeavily indebted poor countries (HIPC)High incomeHondurasHungaryIBRD onlyIcelandIDA & IBRD totalIDA blendIDA onlyIDA totalIndiaIndonesiaIran, Islamic Rep.IraqIrelandIsraelItalyJamaicaJapanJordanKazakhstanKenyaKiribatiKorea, Rep.KuwaitKyrgyz RepublicLao PDRLate-demographic dividendLatin America & Caribbean Latin America & Caribbean (excluding high income)Latin America & the Caribbean (IDA & IBRD countries)LatviaLeast developed countries: UN classificationLebanonLesothoLiberiaLibyaLithuaniaLow & middle incomeLow incomeLower middle incomeLuxembourgMacedonia, FYRMadagascarMalawiMalaysiaMaldivesMaliMauritaniaMauritiusMexicoMiddle East & North AfricaMiddle East & North Africa (excluding high income)Middle East & North Africa (IDA & IBRD countries)Middle incomeMoldovaMongoliaMoroccoMozambiqueNamibiaNepalNetherlandsNew ZealandNicaraguaNigerNigeriaNorth AmericaNorwayOECD membersOmanOther small statesPacific island small statesPakistanPanamaPapua New GuineaParaguayPeruPhilippinesPolandPortugalPost-demographic dividendPre-demographic dividendQatarRomaniaRussian FederationRwandaSaudi ArabiaSenegalSeychellesSierra LeoneSingaporeSlovak RepublicSloveniaSmall statesSolomon IslandsSouth AfricaSouth AsiaSouth Asia (IDA & IBRD)SpainSri LankaSt. LuciaSt. Vincent and the GrenadinesSub-Saharan Africa Sub-Saharan Africa (excluding high income)Sub-Saharan Africa (IDA & IBRD countries)SudanSurinameSwazilandSwedenSwitzerlandSyrian Arab RepublicTajikistanTanzaniaThailandTogoTongaTrinidad and TobagoTunisiaTurkeyUgandaUkraineUnited KingdomUnited StatesUpper middle incomeUruguayVanuatuVenezuela, RBVietnamWorldYemen, Rep.ZambiaZimbabwe Timeline:
This timeline shows a graph from 1971 to 2015 of United States. No data until 1970. Number of actual observations by date: 45.
Source name:
World Development Indicators
Source organization:
World Bank staff estimates based on sources and methods in World Bank's "The Changing Wealth of Nations: Measuring Sustainable Development in the New Millennium" (2011).
Categories, topics:
Economy & Growth, Environment
Last updated:
apr 23, 2017
Indicators value changes by year
Maximum:
16.446
jan 1, 1974
At the date of observation
Value
Absolute change
Change from previous value
jan 1, 1971
14.9
+14.9
0.0%
jan 1, 1972
14.307
-0.593
-3.98%
jan 1, 1973
15.065
+0.758
5.29%
jan 1, 1974
16.446
+1.382
9.17%
jan 1, 1975
12.476
-3.971
-24.14%
jan 1, 1976
10.862
-1.613
-12.93%
jan 1, 1977
11.756
+0.894
8.23%
jan 1, 1978
12.217
+0.461
3.92%
jan 1, 1979
13.394
+1.176
9.63%
jan 1, 1980
11.035
-2.358
-17.61%
jan 1, 1981
8.676
-2.359
-21.38%
jan 1, 1982
10.404
+1.728
19.92%
jan 1, 1983
8.399
-2.006
-19.28%
jan 1, 1984
7.937
-0.462
-5.5%
jan 1, 1985
11.033
+3.096
39.01%
jan 1, 1986
9.776
-1.257
-11.4%
jan 1, 1987
7.22
-2.556
-26.14%
jan 1, 1988
9.899
+2.679
37.1%
jan 1, 1989
9.036
-0.862
-8.71%
jan 1, 1990
8.336
-0.701
-7.76%
jan 1, 1991
7.144
-1.191
-14.29%
jan 1, 1992
7.212
+0.068
0.95%
jan 1, 1993
7.54
+0.328
4.55%
jan 1, 1994
6.676
-0.864
-11.45%
jan 1, 1995
7.974
+1.298
19.44%
jan 1, 1996
8.046
+0.072
0.9%
jan 1, 1997
8.883
+0.837
10.4%
jan 1, 1998
10.269
+1.386
15.61%
jan 1, 1999
10.526
+0.257
2.51%
jan 1, 2000
9.987
-0.539
-5.12%
jan 1, 2001
9.345
-0.643
-6.43%
jan 1, 2002
8.22
-1.125
-12.04%
jan 1, 2003
7.029
-1.191
-14.49%
jan 1, 2004
6.288
-0.741
-10.54%
jan 1, 2005
6.177
-0.11
-1.76%
jan 1, 2006
5.808
-0.37
-5.99%
jan 1, 2007
6.968
+1.161
19.98%
jan 1, 2008
4.86
-2.108
-30.25%
jan 1, 2009
2.076
-2.784
-57.28%
jan 1, 2010
1.736
-0.34
-16.38%
jan 1, 2011
2.973
+1.237
71.27%
jan 1, 2012
3.713
+0.74
24.88%
jan 1, 2013
5.848
+2.135
57.51%
jan 1, 2014
5.621
-0.227
-3.88%
jan 1, 2015
6.56
+0.939
16.71%
Ranking of countries by current statistics by years


Comments: