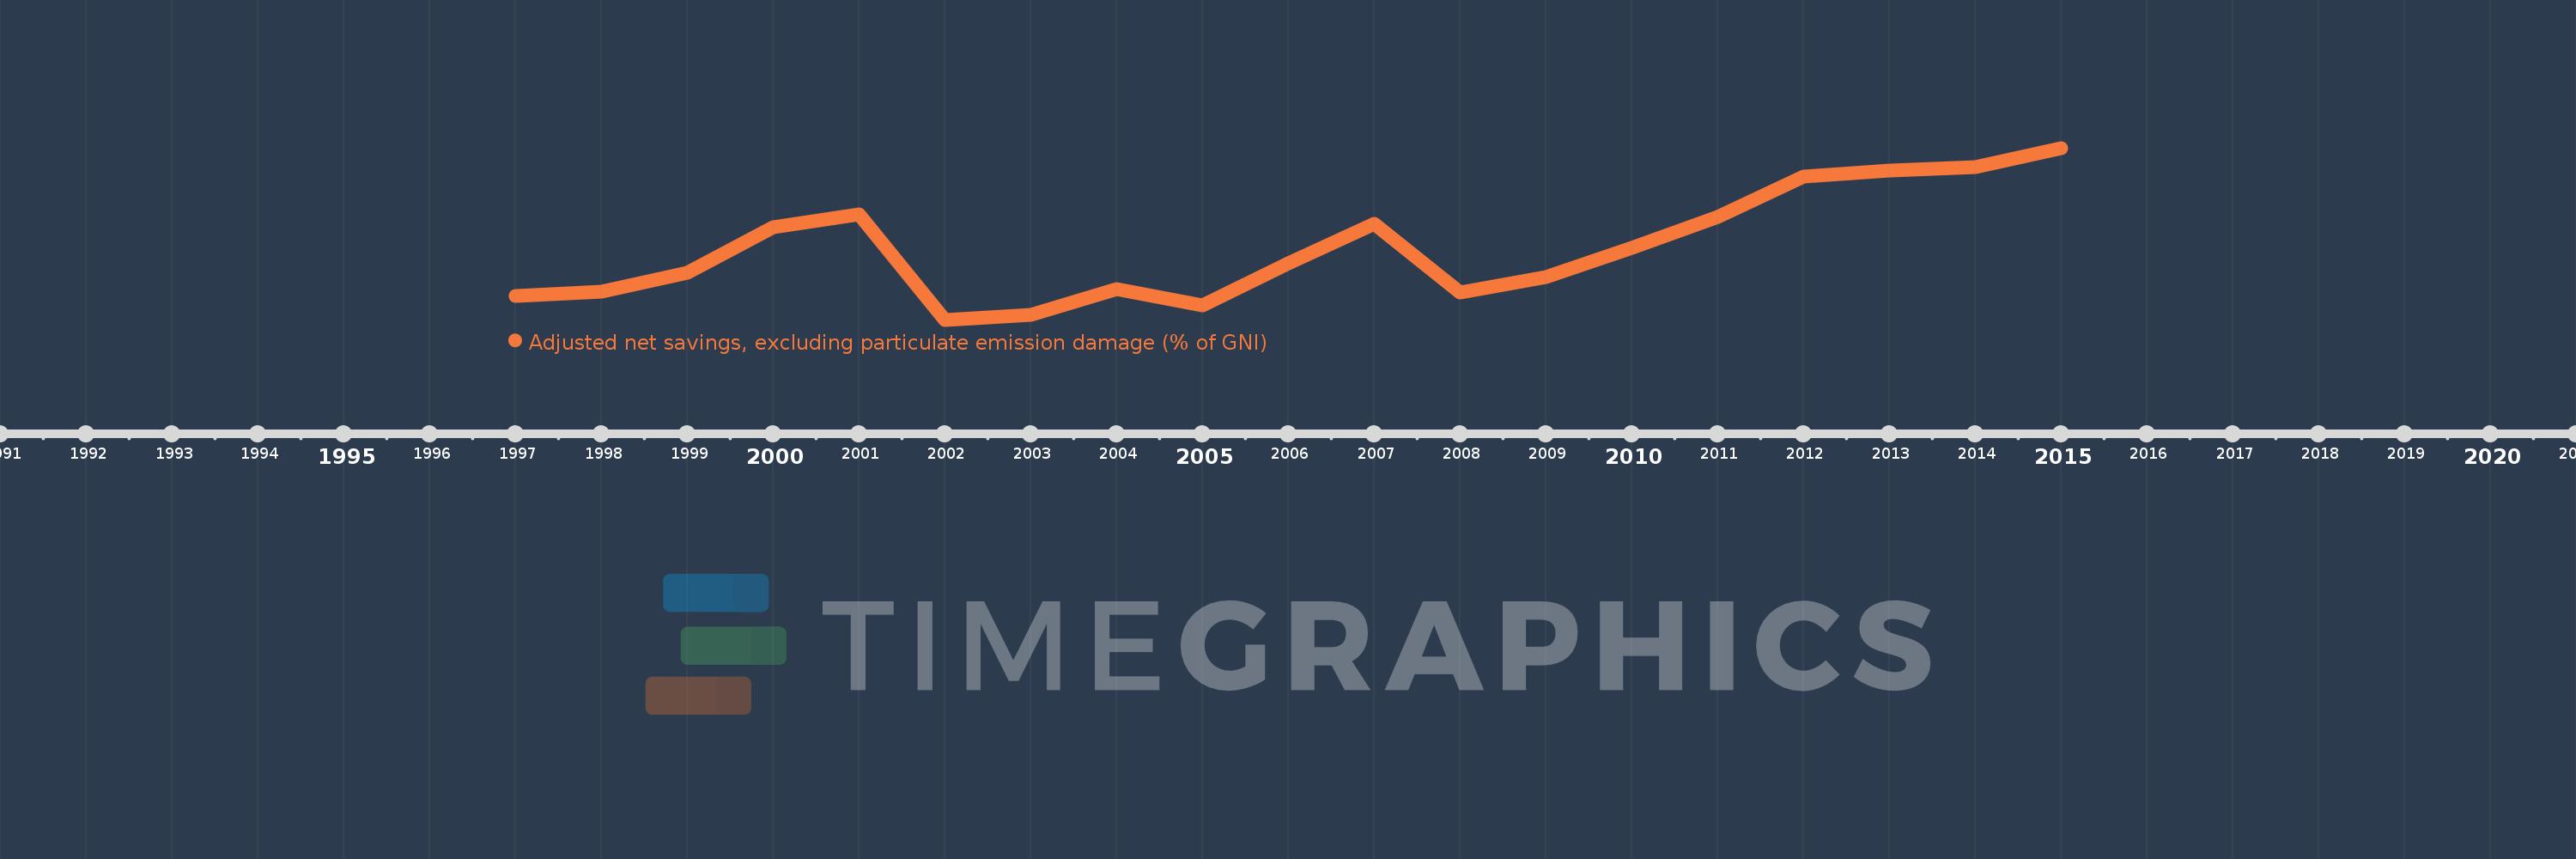
This timeline shows a graph from 1997 to 2015 of Macedonia, FYR. No data until 1996. Number of actual observations by date: 19.
Source name:
World Development Indicators
Source organization:
World Bank staff estimates based on sources and methods in World Bank's "The Changing Wealth of Nations: Measuring Sustainable Development in the New Millennium" (2011).
Categories, topics:
Economy & Growth, Environment
Last updated:
apr 23, 2017
Indicators value changes by year
Meaning:
3.549
Minimum:
-3.903
jan 1, 2002
Maximum:
13.968
jan 1, 2015
At the date of observation
Value
Absolute change
Change from the previous value
jan 1, 1997
-1.391
-1.391
0.0%
jan 1, 1998
-1.003
+0.388
-27.88%
jan 1, 1999
1.019
+2.022
-201.57%
jan 1, 2000
5.685
+4.666
457.97%
jan 1, 2001
7.034
+1.349
23.73%
jan 1, 2002
-3.903
-10.937
-155.49%
jan 1, 2003
-3.363
+0.54
-13.83%
jan 1, 2004
-0.727
+2.636
-78.38%
jan 1, 2005
-2.441
-1.714
235.64%
jan 1, 2006
2.009
+4.449
-182.3%
jan 1, 2007
6.093
+4.084
203.34%
jan 1, 2008
-1.026
-7.12
-116.84%
jan 1, 2009
0.533
+1.559
-151.92%
jan 1, 2010
3.581
+3.048
572.08%
jan 1, 2011
6.8
+3.219
89.88%
jan 1, 2012
10.983
+4.182
61.5%
jan 1, 2013
11.639
+0.656
5.97%
jan 1, 2014
11.95
+0.312
2.68%
jan 1, 2015
13.968
+2.018
16.89%
Ranking of countries by current statistics by years
