29
/
en
AIzaSyAYiBZKx7MnpbEhh9jyipgxe19OcubqV5w
April 1, 2024
89428
Botswana
BWA
true
2
1
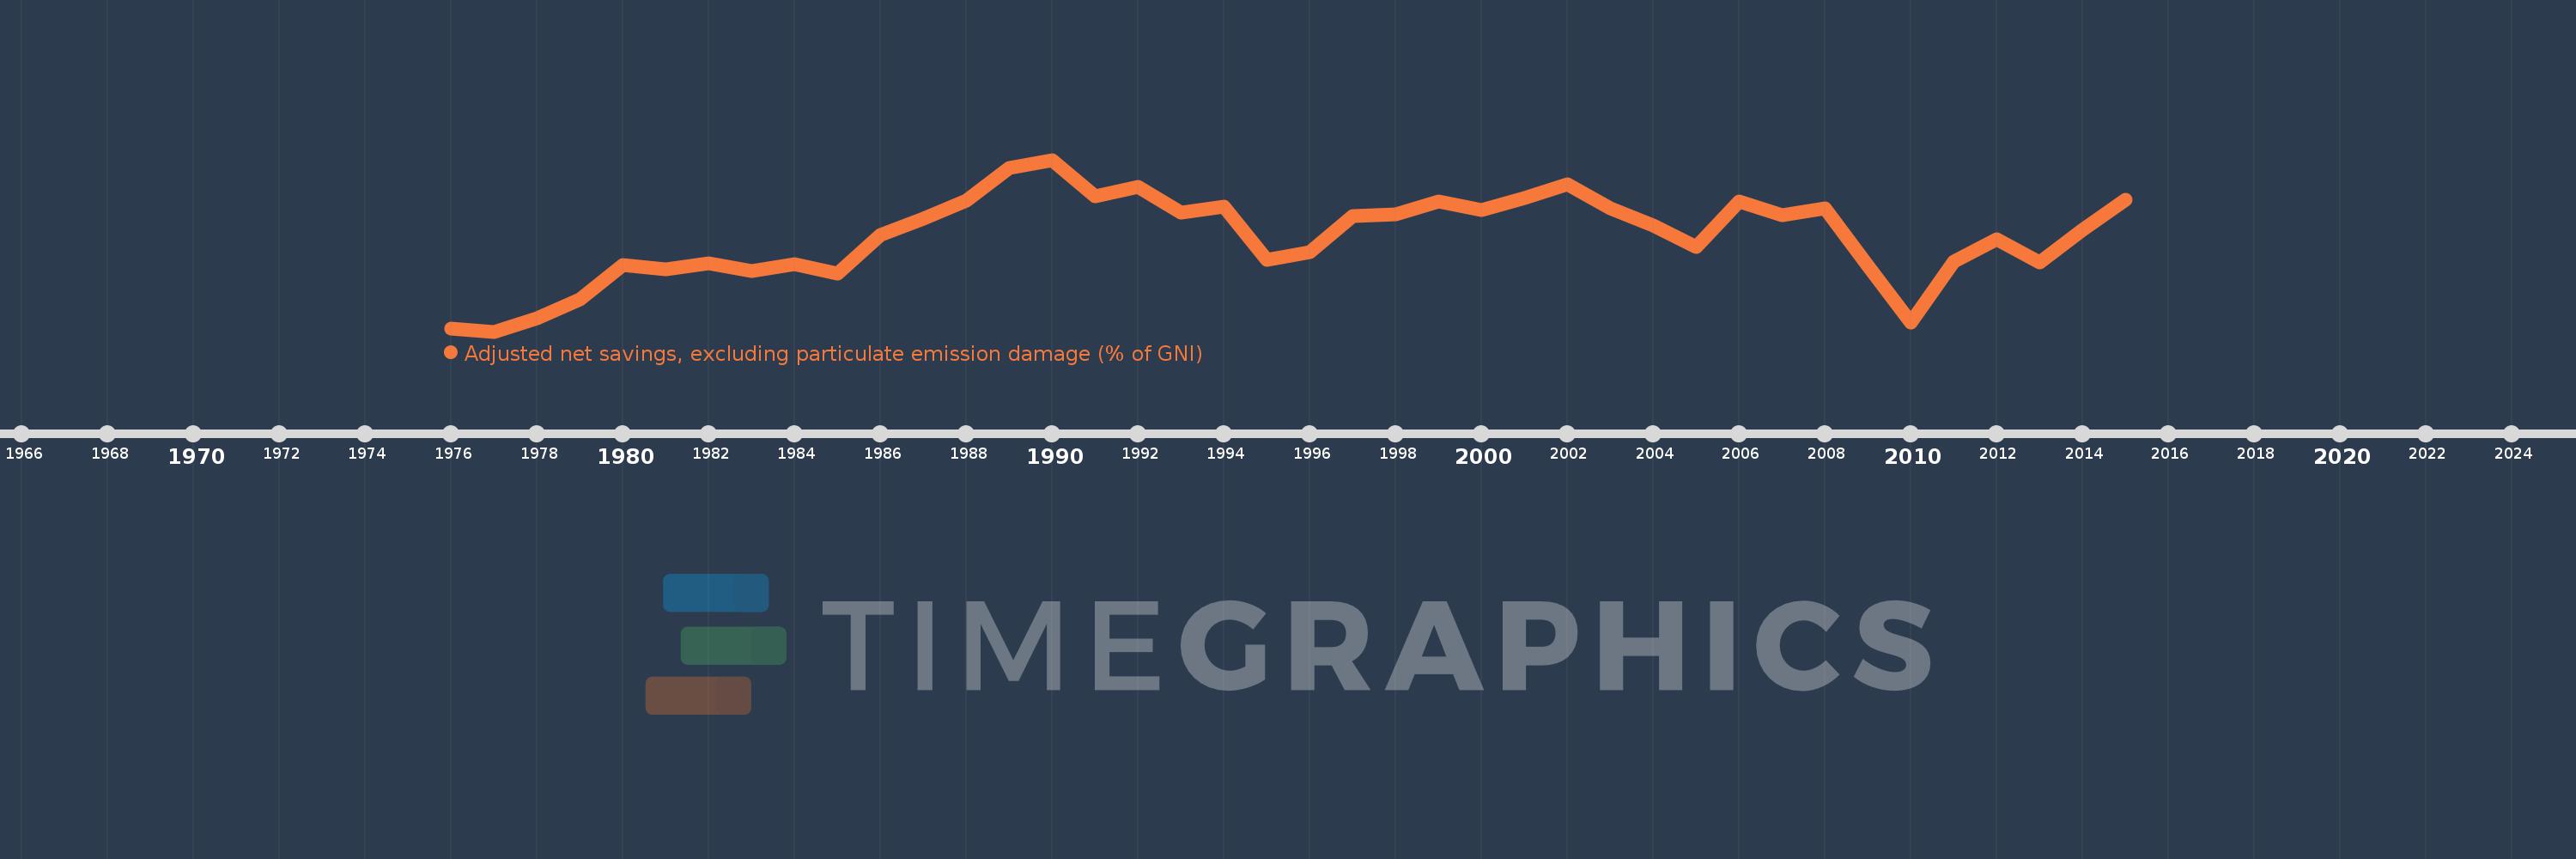
Adjusted net savings, excluding particulate emission damage (% of GNI)
2015,2014,2013,2012,2011,2010,2009,2008,2007,2006,2005,2004,2003,2002,2001,2000,1999,1998,1997,1996,1995,1994,1993,1992,1991,1990,1989,1988,1987,1986,1985,1984,1983,1982,1981,1980,1979,1978,1977,1976
This statistics in other country:
AfghanistanAlbaniaAlgeriaAngolaArab WorldArgentinaArmeniaAustraliaAustriaAzerbaijanBahamas, TheBahrainBangladeshBarbadosBelarusBelgiumBelizeBeninBhutanBoliviaBotswanaBrazilBrunei DarussalamBulgariaBurkina FasoBurundiCabo VerdeCambodiaCameroonCanadaCaribbean small statesCentral African RepublicCentral Europe and the BalticsChadChileChinaColombiaComorosCongo, Dem. Rep.Congo, Rep.Costa RicaCote d'IvoireCroatiaCyprusCzech RepublicDenmarkDjiboutiDominicaDominican RepublicEarly-demographic dividendEast Asia & PacificEast Asia & Pacific (excluding high income)East Asia & Pacific (IDA & IBRD countries)EcuadorEgypt, Arab Rep.El SalvadorEquatorial GuineaEritreaEstoniaEthiopiaEuro areaEurope & Central AsiaEurope & Central Asia (excluding high income)Europe & Central Asia (IDA & IBRD countries)European UnionFijiFinlandFragile and conflict affected situationsFranceGabonGambia, TheGeorgiaGermanyGhanaGreeceGuatemalaGuineaGuinea-BissauGuyanaHaitiHeavily indebted poor countries (HIPC)High incomeHondurasHungaryIBRD onlyIcelandIDA & IBRD totalIDA blendIDA onlyIDA totalIndiaIndonesiaIran, Islamic Rep.IraqIrelandIsraelItalyJamaicaJapanJordanKazakhstanKenyaKiribatiKorea, Rep.KuwaitKyrgyz RepublicLao PDRLate-demographic dividendLatin America & Caribbean Latin America & Caribbean (excluding high income)Latin America & the Caribbean (IDA & IBRD countries)LatviaLeast developed countries: UN classificationLebanonLesothoLiberiaLibyaLithuaniaLow & middle incomeLow incomeLower middle incomeLuxembourgMacedonia, FYRMadagascarMalawiMalaysiaMaldivesMaliMauritaniaMauritiusMexicoMiddle East & North AfricaMiddle East & North Africa (excluding high income)Middle East & North Africa (IDA & IBRD countries)Middle incomeMoldovaMongoliaMoroccoMozambiqueNamibiaNepalNetherlandsNew ZealandNicaraguaNigerNigeriaNorth AmericaNorwayOECD membersOmanOther small statesPacific island small statesPakistanPanamaPapua New GuineaParaguayPeruPhilippinesPolandPortugalPost-demographic dividendPre-demographic dividendQatarRomaniaRussian FederationRwandaSaudi ArabiaSenegalSeychellesSierra LeoneSingaporeSlovak RepublicSloveniaSmall statesSolomon IslandsSouth AfricaSouth AsiaSouth Asia (IDA & IBRD)SpainSri LankaSt. LuciaSt. Vincent and the GrenadinesSub-Saharan Africa Sub-Saharan Africa (excluding high income)Sub-Saharan Africa (IDA & IBRD countries)SudanSurinameSwazilandSwedenSwitzerlandSyrian Arab RepublicTajikistanTanzaniaThailandTogoTongaTrinidad and TobagoTunisiaTurkeyUgandaUkraineUnited KingdomUnited StatesUpper middle incomeUruguayVanuatuVenezuela, RBVietnamWorldYemen, Rep.ZambiaZimbabwe Timeline:
This timeline shows a graph from 1976 to 2015 of Botswana. No data until 1975. Number of actual observations by date: 40.
Source name:
World Development Indicators
Source organization:
World Bank staff estimates based on sources and methods in World Bank's "The Changing Wealth of Nations: Measuring Sustainable Development in the New Millennium" (2011).
Categories, topics:
Economy & Growth, Environment
Last updated:
apr 23, 2017
Indicators value changes by year
Maximum:
43.458
jan 1, 1990
At the date of observation
Value
Absolute change
Change from previous value
jan 1, 1976
7.315
+7.315
0.0%
jan 1, 1977
6.6
-0.715
-9.78%
jan 1, 1978
9.506
+2.906
44.03%
jan 1, 1979
13.571
+4.066
42.77%
jan 1, 1980
20.922
+7.351
54.16%
jan 1, 1981
19.972
-0.95
-4.54%
jan 1, 1982
21.235
+1.263
6.32%
jan 1, 1983
19.525
-1.71
-8.05%
jan 1, 1984
21.007
+1.483
7.59%
jan 1, 1985
19.052
-1.955
-9.31%
jan 1, 1986
27.371
+8.319
43.67%
jan 1, 1987
30.78
+3.409
12.45%
jan 1, 1988
34.763
+3.982
12.94%
jan 1, 1989
41.626
+6.863
19.74%
jan 1, 1990
43.458
+1.832
4.4%
jan 1, 1991
35.62
-7.837
-18.03%
jan 1, 1992
37.689
+2.069
5.81%
jan 1, 1993
32.084
-5.605
-14.87%
jan 1, 1994
33.334
+1.25
3.9%
jan 1, 1995
22.034
-11.3
-33.9%
jan 1, 1996
23.679
+1.645
7.47%
jan 1, 1997
31.437
+7.758
32.76%
jan 1, 1998
31.673
+0.236
0.75%
jan 1, 1999
34.507
+2.833
8.95%
jan 1, 2000
32.746
-1.76
-5.1%
jan 1, 2001
35.344
+2.597
7.93%
jan 1, 2002
38.266
+2.922
8.27%
jan 1, 2003
33.029
-5.237
-13.69%
jan 1, 2004
29.319
-3.71
-11.23%
jan 1, 2005
24.744
-4.575
-15.61%
jan 1, 2006
34.52
+9.777
39.51%
jan 1, 2007
31.572
-2.948
-8.54%
jan 1, 2008
33.098
+1.526
4.83%
jan 1, 2009
20.773
-12.325
-37.24%
jan 1, 2010
8.554
-12.218
-58.82%
jan 1, 2011
21.655
+13.101
153.15%
jan 1, 2012
26.446
+4.791
22.12%
jan 1, 2013
21.478
-4.969
-18.79%
jan 1, 2014
28.365
+6.888
32.07%
jan 1, 2015
34.863
+6.497
22.91%
Ranking of countries by current statistics by years


Comments: