29
/
en
AIzaSyAYiBZKx7MnpbEhh9jyipgxe19OcubqV5w
April 1, 2024
171393
Kuwait
KWT
true
2
1
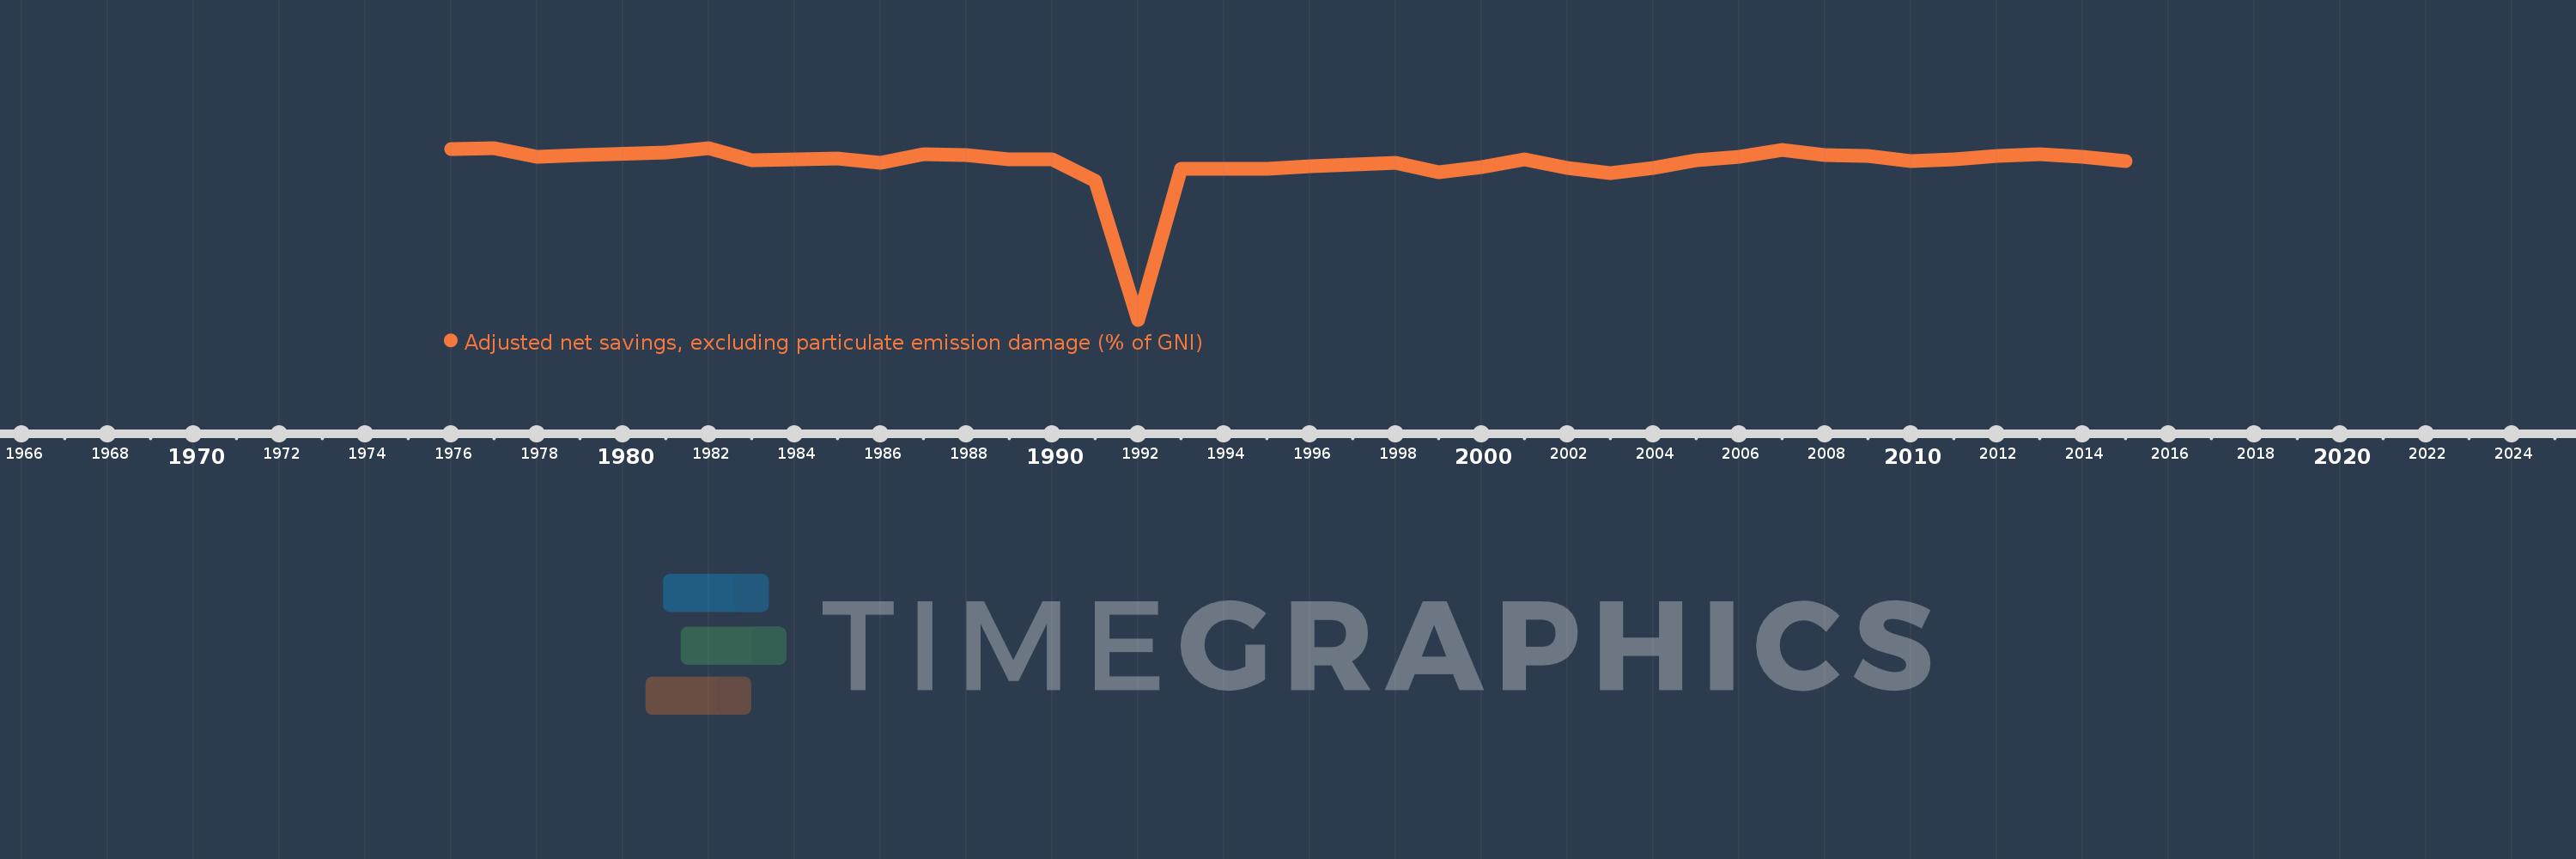
Adjusted net savings, excluding particulate emission damage (% of GNI)
2015,2014,2013,2012,2011,2010,2009,2008,2007,2006,2005,2004,2003,2002,2001,2000,1999,1998,1997,1996,1995,1994,1993,1992,1991,1990,1989,1988,1987,1986,1985,1984,1983,1982,1981,1979,1978,1977,1976
This statistics in other country:
AfghanistanAlbaniaAlgeriaAngolaArab WorldArgentinaArmeniaAustraliaAustriaAzerbaijanBahamas, TheBahrainBangladeshBarbadosBelarusBelgiumBelizeBeninBhutanBoliviaBotswanaBrazilBrunei DarussalamBulgariaBurkina FasoBurundiCabo VerdeCambodiaCameroonCanadaCaribbean small statesCentral African RepublicCentral Europe and the BalticsChadChileChinaColombiaComorosCongo, Dem. Rep.Congo, Rep.Costa RicaCote d'IvoireCroatiaCyprusCzech RepublicDenmarkDjiboutiDominicaDominican RepublicEarly-demographic dividendEast Asia & PacificEast Asia & Pacific (excluding high income)East Asia & Pacific (IDA & IBRD countries)EcuadorEgypt, Arab Rep.El SalvadorEquatorial GuineaEritreaEstoniaEthiopiaEuro areaEurope & Central AsiaEurope & Central Asia (excluding high income)Europe & Central Asia (IDA & IBRD countries)European UnionFijiFinlandFragile and conflict affected situationsFranceGabonGambia, TheGeorgiaGermanyGhanaGreeceGuatemalaGuineaGuinea-BissauGuyanaHaitiHeavily indebted poor countries (HIPC)High incomeHondurasHungaryIBRD onlyIcelandIDA & IBRD totalIDA blendIDA onlyIDA totalIndiaIndonesiaIran, Islamic Rep.IraqIrelandIsraelItalyJamaicaJapanJordanKazakhstanKenyaKiribatiKorea, Rep.KuwaitKyrgyz RepublicLao PDRLate-demographic dividendLatin America & Caribbean Latin America & Caribbean (excluding high income)Latin America & the Caribbean (IDA & IBRD countries)LatviaLeast developed countries: UN classificationLebanonLesothoLiberiaLibyaLithuaniaLow & middle incomeLow incomeLower middle incomeLuxembourgMacedonia, FYRMadagascarMalawiMalaysiaMaldivesMaliMauritaniaMauritiusMexicoMiddle East & North AfricaMiddle East & North Africa (excluding high income)Middle East & North Africa (IDA & IBRD countries)Middle incomeMoldovaMongoliaMoroccoMozambiqueNamibiaNepalNetherlandsNew ZealandNicaraguaNigerNigeriaNorth AmericaNorwayOECD membersOmanOther small statesPacific island small statesPakistanPanamaPapua New GuineaParaguayPeruPhilippinesPolandPortugalPost-demographic dividendPre-demographic dividendQatarRomaniaRussian FederationRwandaSaudi ArabiaSenegalSeychellesSierra LeoneSingaporeSlovak RepublicSloveniaSmall statesSolomon IslandsSouth AfricaSouth AsiaSouth Asia (IDA & IBRD)SpainSri LankaSt. LuciaSt. Vincent and the GrenadinesSub-Saharan Africa Sub-Saharan Africa (excluding high income)Sub-Saharan Africa (IDA & IBRD countries)SudanSurinameSwazilandSwedenSwitzerlandSyrian Arab RepublicTajikistanTanzaniaThailandTogoTongaTrinidad and TobagoTunisiaTurkeyUgandaUkraineUnited KingdomUnited StatesUpper middle incomeUruguayVanuatuVenezuela, RBVietnamWorldYemen, Rep.ZambiaZimbabwe Timeline:
This timeline shows a graph from 1976 to 2015 of Kuwait. No data until 1975. Number of actual observations by date: 39.
Source name:
World Development Indicators
Source organization:
World Bank staff estimates based on sources and methods in World Bank's "The Changing Wealth of Nations: Measuring Sustainable Development in the New Millennium" (2011).
Categories, topics:
Economy & Growth, Environment
Last updated:
apr 23, 2017
Indicators value changes by year
Minimum:
-167.514
jan 1, 1992
Maximum:
34.457
jan 1, 1977
At the date of observation
Value
Absolute change
Change from previous value
jan 1, 1976
32.781
+32.781
0.0%
jan 1, 1977
34.457
+1.675
5.11%
jan 1, 1978
24.089
-10.367
-30.09%
jan 1, 1979
25.623
+1.534
6.37%
jan 1, 1981
29.043
+3.42
13.35%
jan 1, 1982
33.997
+4.954
17.06%
jan 1, 1983
19.641
-14.356
-42.23%
jan 1, 1984
21.143
+1.502
7.65%
jan 1, 1985
21.721
+0.578
2.73%
jan 1, 1986
16.684
-5.037
-23.19%
jan 1, 1987
26.662
+9.978
59.8%
jan 1, 1988
26.484
-0.178
-0.67%
jan 1, 1989
20.567
-5.916
-22.34%
jan 1, 1990
21.223
+0.656
3.19%
jan 1, 1991
-4.128
-25.351
-119.45%
jan 1, 1992
-167.514
-163.387
3.96K%
jan 1, 1993
10.275
+177.789
-106.13%
jan 1, 1994
10.285
+0.01
0.09%
jan 1, 1995
10.344
+0.059
0.57%
jan 1, 1996
12.574
+2.231
21.57%
jan 1, 1997
15.277
+2.702
21.49%
jan 1, 1998
17.014
+1.737
11.37%
jan 1, 1999
6.241
-10.772
-63.32%
jan 1, 2000
11.631
+5.389
86.35%
jan 1, 2001
20.571
+8.941
76.87%
jan 1, 2002
11.037
-9.535
-46.35%
jan 1, 2003
4.457
-6.58
-59.62%
jan 1, 2004
11.08
+6.623
148.61%
jan 1, 2005
19.596
+8.515
76.85%
jan 1, 2006
24.365
+4.769
24.34%
jan 1, 2007
31.842
+7.477
30.69%
jan 1, 2008
26.152
-5.69
-17.87%
jan 1, 2009
25.518
-0.634
-2.43%
jan 1, 2010
18.786
-6.732
-26.38%
jan 1, 2011
20.676
+1.89
10.06%
jan 1, 2012
25.522
+4.846
23.44%
jan 1, 2013
27.356
+1.834
7.19%
jan 1, 2014
24.539
-2.816
-10.3%
jan 1, 2015
18.742
-5.797
-23.62%
Ranking of countries by current statistics by years


Comments: