29
/
en
AIzaSyAYiBZKx7MnpbEhh9jyipgxe19OcubqV5w
April 1, 2024
160176
Israel
ISR
true
2
1
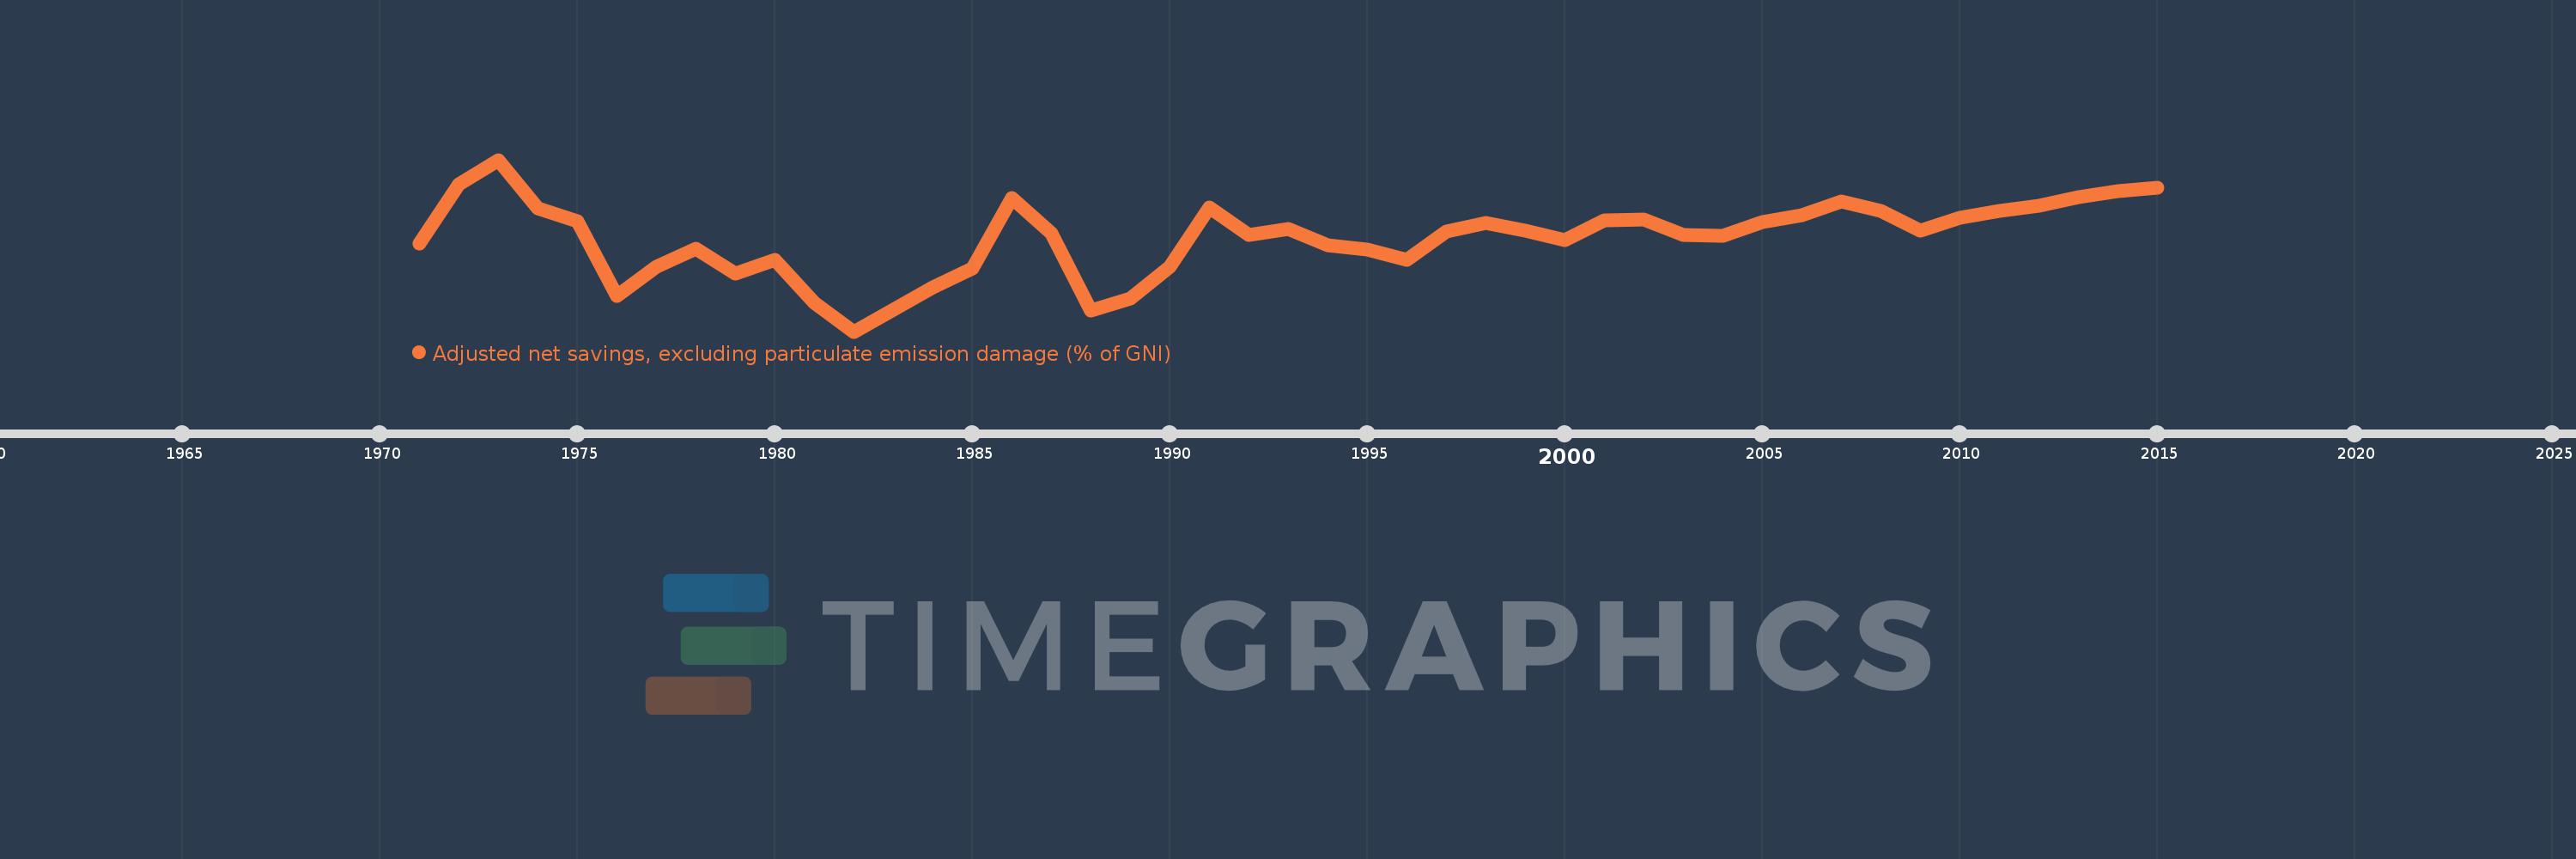
Adjusted net savings, excluding particulate emission damage (% of GNI)
2015,2014,2013,2012,2011,2010,2009,2008,2007,2006,2005,2004,2003,2002,2001,2000,1999,1998,1997,1996,1995,1994,1993,1992,1991,1990,1989,1988,1987,1986,1985,1984,1983,1982,1981,1980,1979,1978,1977,1976,1975,1974,1973,1972,1971
This statistics in other country:
AfghanistanAlbaniaAlgeriaAngolaArab WorldArgentinaArmeniaAustraliaAustriaAzerbaijanBahamas, TheBahrainBangladeshBarbadosBelarusBelgiumBelizeBeninBhutanBoliviaBotswanaBrazilBrunei DarussalamBulgariaBurkina FasoBurundiCabo VerdeCambodiaCameroonCanadaCaribbean small statesCentral African RepublicCentral Europe and the BalticsChadChileChinaColombiaComorosCongo, Dem. Rep.Congo, Rep.Costa RicaCote d'IvoireCroatiaCyprusCzech RepublicDenmarkDjiboutiDominicaDominican RepublicEarly-demographic dividendEast Asia & PacificEast Asia & Pacific (excluding high income)East Asia & Pacific (IDA & IBRD countries)EcuadorEgypt, Arab Rep.El SalvadorEquatorial GuineaEritreaEstoniaEthiopiaEuro areaEurope & Central AsiaEurope & Central Asia (excluding high income)Europe & Central Asia (IDA & IBRD countries)European UnionFijiFinlandFragile and conflict affected situationsFranceGabonGambia, TheGeorgiaGermanyGhanaGreeceGuatemalaGuineaGuinea-BissauGuyanaHaitiHeavily indebted poor countries (HIPC)High incomeHondurasHungaryIBRD onlyIcelandIDA & IBRD totalIDA blendIDA onlyIDA totalIndiaIndonesiaIran, Islamic Rep.IraqIrelandIsraelItalyJamaicaJapanJordanKazakhstanKenyaKiribatiKorea, Rep.KuwaitKyrgyz RepublicLao PDRLate-demographic dividendLatin America & Caribbean Latin America & Caribbean (excluding high income)Latin America & the Caribbean (IDA & IBRD countries)LatviaLeast developed countries: UN classificationLebanonLesothoLiberiaLibyaLithuaniaLow & middle incomeLow incomeLower middle incomeLuxembourgMacedonia, FYRMadagascarMalawiMalaysiaMaldivesMaliMauritaniaMauritiusMexicoMiddle East & North AfricaMiddle East & North Africa (excluding high income)Middle East & North Africa (IDA & IBRD countries)Middle incomeMoldovaMongoliaMoroccoMozambiqueNamibiaNepalNetherlandsNew ZealandNicaraguaNigerNigeriaNorth AmericaNorwayOECD membersOmanOther small statesPacific island small statesPakistanPanamaPapua New GuineaParaguayPeruPhilippinesPolandPortugalPost-demographic dividendPre-demographic dividendQatarRomaniaRussian FederationRwandaSaudi ArabiaSenegalSeychellesSierra LeoneSingaporeSlovak RepublicSloveniaSmall statesSolomon IslandsSouth AfricaSouth AsiaSouth Asia (IDA & IBRD)SpainSri LankaSt. LuciaSt. Vincent and the GrenadinesSub-Saharan Africa Sub-Saharan Africa (excluding high income)Sub-Saharan Africa (IDA & IBRD countries)SudanSurinameSwazilandSwedenSwitzerlandSyrian Arab RepublicTajikistanTanzaniaThailandTogoTongaTrinidad and TobagoTunisiaTurkeyUgandaUkraineUnited KingdomUnited StatesUpper middle incomeUruguayVanuatuVenezuela, RBVietnamWorldYemen, Rep.ZambiaZimbabwe Timeline:
This timeline shows a graph from 1971 to 2015 of Israel. No data until 1970. Number of actual observations by date: 45.
Source name:
World Development Indicators
Source organization:
World Bank staff estimates based on sources and methods in World Bank's "The Changing Wealth of Nations: Measuring Sustainable Development in the New Millennium" (2011).
Categories, topics:
Economy & Growth, Environment
Last updated:
apr 23, 2017
Indicators value changes by year
Minimum:
-1.399
jan 1, 1982
Maximum:
18.645
jan 1, 1973
At the date of observation
Value
Absolute change
Change from previous value
jan 1, 1971
8.884
+8.884
0.0%
jan 1, 1972
15.798
+6.914
77.83%
jan 1, 1973
18.645
+2.847
18.02%
jan 1, 1974
12.938
-5.707
-30.61%
jan 1, 1975
11.499
-1.439
-11.12%
jan 1, 1976
2.715
-8.784
-76.39%
jan 1, 1977
6.124
+3.409
125.54%
jan 1, 1978
8.31
+2.186
35.69%
jan 1, 1979
5.319
-2.991
-35.99%
jan 1, 1980
6.946
+1.627
30.59%
jan 1, 1981
1.945
-5.001
-72.0%
jan 1, 1982
-1.399
-3.344
-171.94%
jan 1, 1983
1.199
+2.598
-185.65%
jan 1, 1984
3.727
+2.528
210.94%
jan 1, 1985
5.929
+2.202
59.08%
jan 1, 1986
14.196
+8.267
139.45%
jan 1, 1987
10.109
-4.087
-28.79%
jan 1, 1988
1.079
-9.03
-89.33%
jan 1, 1989
2.435
+1.356
125.72%
jan 1, 1990
6.199
+3.764
154.57%
jan 1, 1991
13.121
+6.923
111.68%
jan 1, 1992
9.903
-3.218
-24.52%
jan 1, 1993
10.586
+0.683
6.89%
jan 1, 1994
8.674
-1.912
-18.06%
jan 1, 1995
8.191
-0.484
-5.57%
jan 1, 1996
6.959
-1.232
-15.04%
jan 1, 1997
10.308
+3.349
48.13%
jan 1, 1998
11.296
+0.988
9.58%
jan 1, 1999
10.359
-0.937
-8.29%
jan 1, 2000
9.292
-1.068
-10.31%
jan 1, 2001
11.564
+2.273
24.46%
jan 1, 2002
11.692
+0.127
1.1%
jan 1, 2003
9.826
-1.866
-15.96%
jan 1, 2004
9.77
-0.055
-0.56%
jan 1, 2005
11.42
+1.65
16.89%
jan 1, 2006
12.196
+0.775
6.79%
jan 1, 2007
13.754
+1.558
12.77%
jan 1, 2008
12.648
-1.105
-8.04%
jan 1, 2009
10.347
-2.302
-18.2%
jan 1, 2010
11.849
+1.503
14.52%
jan 1, 2011
12.652
+0.803
6.77%
jan 1, 2012
13.28
+0.628
4.97%
jan 1, 2013
14.298
+1.017
7.66%
jan 1, 2014
15.019
+0.722
5.05%
jan 1, 2015
15.365
+0.346
2.3%
Ranking of countries by current statistics by years


Comments: