29
/
en
AIzaSyAYiBZKx7MnpbEhh9jyipgxe19OcubqV5w
April 1, 2024
47887
Middle East & North Africa
MEA
false
2
1
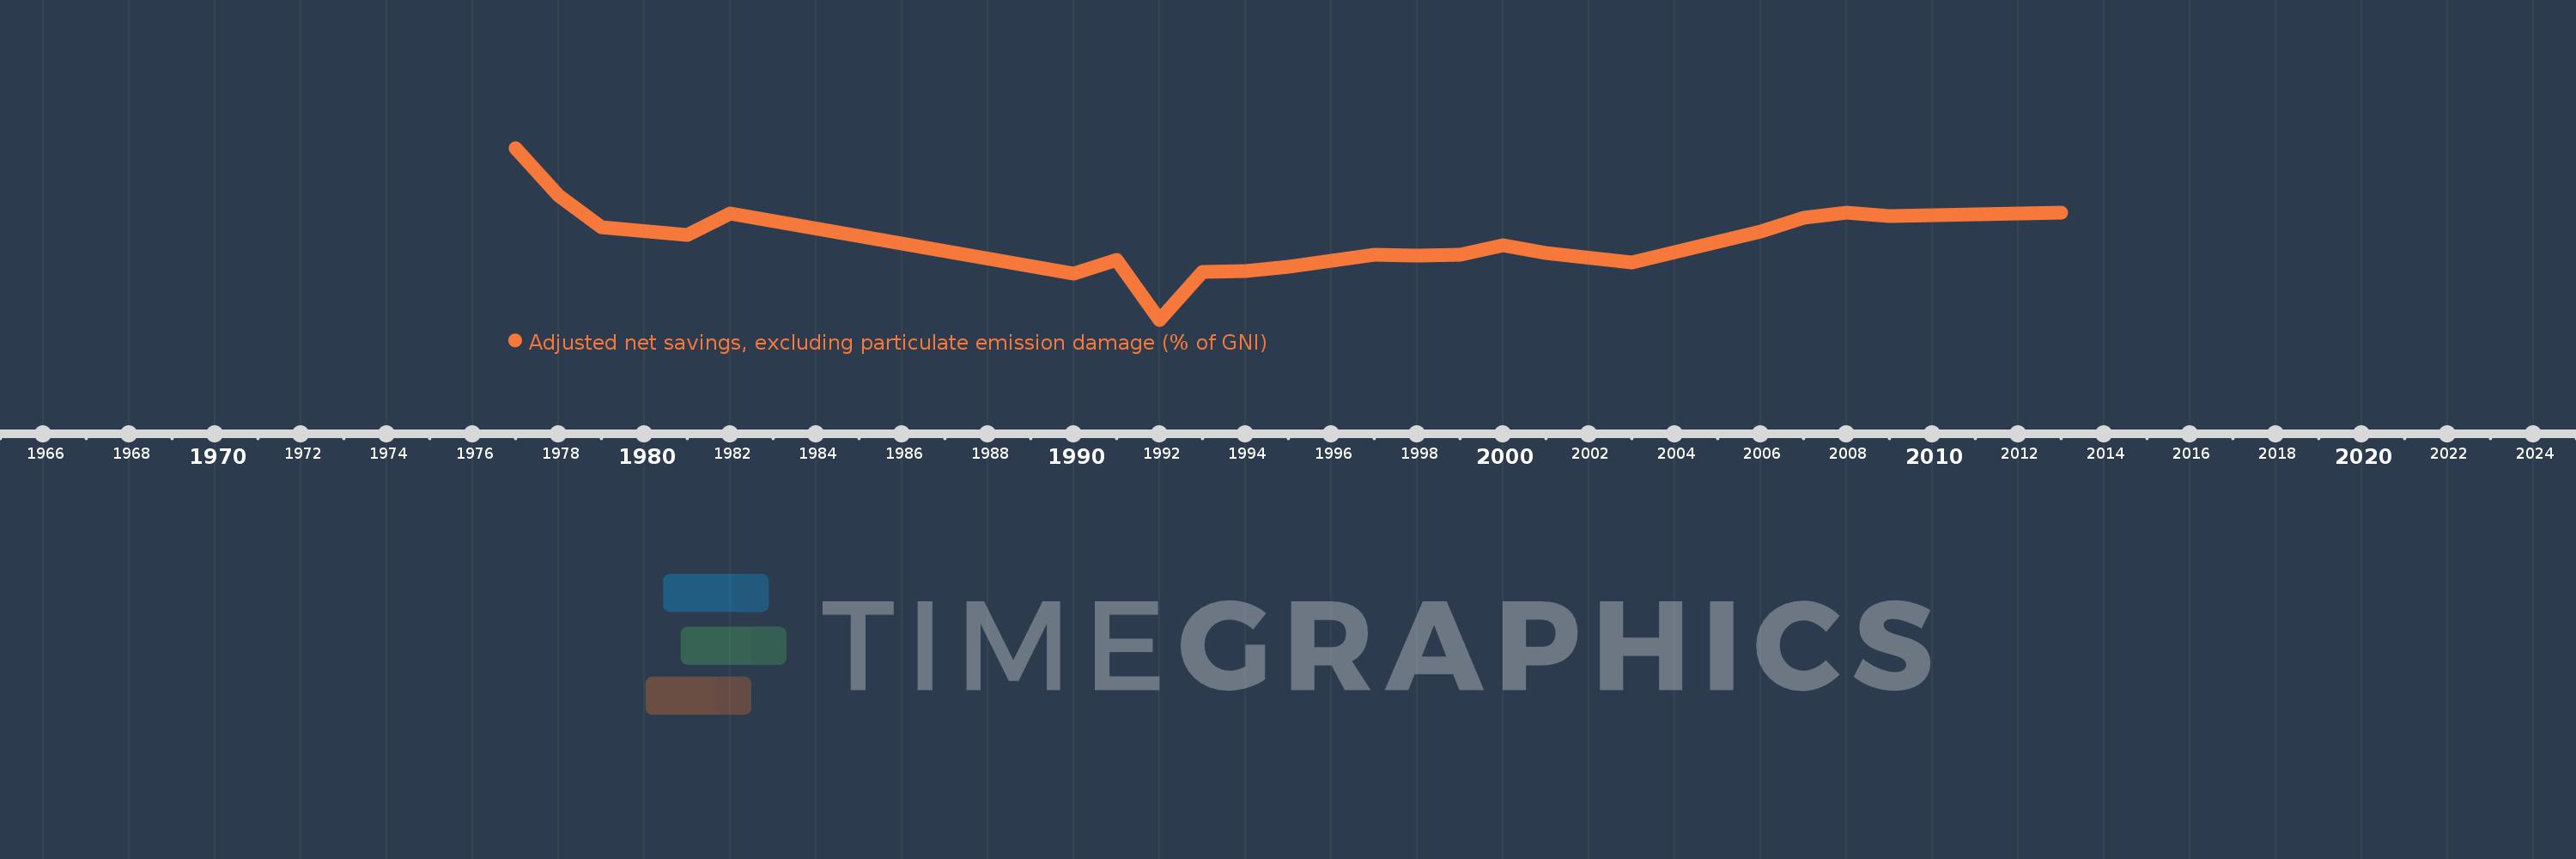
Adjusted net savings, excluding particulate emission damage (% of GNI)
2013,2012,2009,2008,2007,2006,2003,2001,2000,1999,1998,1997,1996,1995,1994,1993,1992,1991,1990,1982,1981,1979,1978,1977
This statistics in other country:
AfghanistanAlbaniaAlgeriaAngolaArab WorldArgentinaArmeniaAustraliaAustriaAzerbaijanBahamas, TheBahrainBangladeshBarbadosBelarusBelgiumBelizeBeninBhutanBoliviaBotswanaBrazilBrunei DarussalamBulgariaBurkina FasoBurundiCabo VerdeCambodiaCameroonCanadaCaribbean small statesCentral African RepublicCentral Europe and the BalticsChadChileChinaColombiaComorosCongo, Dem. Rep.Congo, Rep.Costa RicaCote d'IvoireCroatiaCyprusCzech RepublicDenmarkDjiboutiDominicaDominican RepublicEarly-demographic dividendEast Asia & PacificEast Asia & Pacific (excluding high income)East Asia & Pacific (IDA & IBRD countries)EcuadorEgypt, Arab Rep.El SalvadorEquatorial GuineaEritreaEstoniaEthiopiaEuro areaEurope & Central AsiaEurope & Central Asia (excluding high income)Europe & Central Asia (IDA & IBRD countries)European UnionFijiFinlandFragile and conflict affected situationsFranceGabonGambia, TheGeorgiaGermanyGhanaGreeceGuatemalaGuineaGuinea-BissauGuyanaHaitiHeavily indebted poor countries (HIPC)High incomeHondurasHungaryIBRD onlyIcelandIDA & IBRD totalIDA blendIDA onlyIDA totalIndiaIndonesiaIran, Islamic Rep.IraqIrelandIsraelItalyJamaicaJapanJordanKazakhstanKenyaKiribatiKorea, Rep.KuwaitKyrgyz RepublicLao PDRLate-demographic dividendLatin America & Caribbean Latin America & Caribbean (excluding high income)Latin America & the Caribbean (IDA & IBRD countries)LatviaLeast developed countries: UN classificationLebanonLesothoLiberiaLibyaLithuaniaLow & middle incomeLow incomeLower middle incomeLuxembourgMacedonia, FYRMadagascarMalawiMalaysiaMaldivesMaliMauritaniaMauritiusMexicoMiddle East & North AfricaMiddle East & North Africa (excluding high income)Middle East & North Africa (IDA & IBRD countries)Middle incomeMoldovaMongoliaMoroccoMozambiqueNamibiaNepalNetherlandsNew ZealandNicaraguaNigerNigeriaNorth AmericaNorwayOECD membersOmanOther small statesPacific island small statesPakistanPanamaPapua New GuineaParaguayPeruPhilippinesPolandPortugalPost-demographic dividendPre-demographic dividendQatarRomaniaRussian FederationRwandaSaudi ArabiaSenegalSeychellesSierra LeoneSingaporeSlovak RepublicSloveniaSmall statesSolomon IslandsSouth AfricaSouth AsiaSouth Asia (IDA & IBRD)SpainSri LankaSt. LuciaSt. Vincent and the GrenadinesSub-Saharan Africa Sub-Saharan Africa (excluding high income)Sub-Saharan Africa (IDA & IBRD countries)SudanSurinameSwazilandSwedenSwitzerlandSyrian Arab RepublicTajikistanTanzaniaThailandTogoTongaTrinidad and TobagoTunisiaTurkeyUgandaUkraineUnited KingdomUnited StatesUpper middle incomeUruguayVanuatuVenezuela, RBVietnamWorldYemen, Rep.ZambiaZimbabwe Timeline:
This timeline shows a graph from 1977 to 2013 of Middle East & North Africa. No data until 1976. Number of actual observations by date: 24.
Source name:
World Development Indicators
Source organization:
World Bank staff estimates based on sources and methods in World Bank's "The Changing Wealth of Nations: Measuring Sustainable Development in the New Millennium" (2011).
Categories, topics:
Economy & Growth, Environment
Last updated:
apr 23, 2017
Indicators value changes by year
Minimum:
-5.683
jan 1, 1992
Maximum:
30.398
jan 1, 1977
At the date of observation
Value
Absolute change
Change from previous value
jan 1, 1977
30.398
+30.398
0.0%
jan 1, 1978
20.401
-9.997
-32.89%
jan 1, 1979
13.831
-6.569
-32.2%
jan 1, 1981
12.204
-1.627
-11.77%
jan 1, 1982
16.594
+4.39
35.97%
jan 1, 1990
4.081
-12.513
-75.41%
jan 1, 1991
6.933
+2.852
69.89%
jan 1, 1992
-5.683
-12.616
-181.97%
jan 1, 1993
4.323
+10.005
-176.06%
jan 1, 1994
4.555
+0.232
5.36%
jan 1, 1995
5.367
+0.813
17.85%
jan 1, 1996
6.7
+1.333
24.83%
jan 1, 1997
7.89
+1.19
17.76%
jan 1, 1998
7.853
-0.037
-0.47%
jan 1, 1999
7.967
+0.114
1.45%
jan 1, 2000
9.885
+1.918
24.07%
jan 1, 2001
8.253
-1.632
-16.51%
jan 1, 2003
6.273
-1.98
-23.99%
jan 1, 2006
12.755
+6.482
103.33%
jan 1, 2007
15.73
+2.976
23.33%
jan 1, 2008
16.858
+1.127
7.17%
jan 1, 2009
16.052
-0.805
-4.78%
jan 1, 2012
16.587
+0.534
3.33%
jan 1, 2013
16.726
+0.14
0.84%
Ranking of countries by current statistics by years


Comments: